TMV 2-3-18 Update:
TLT weekly:
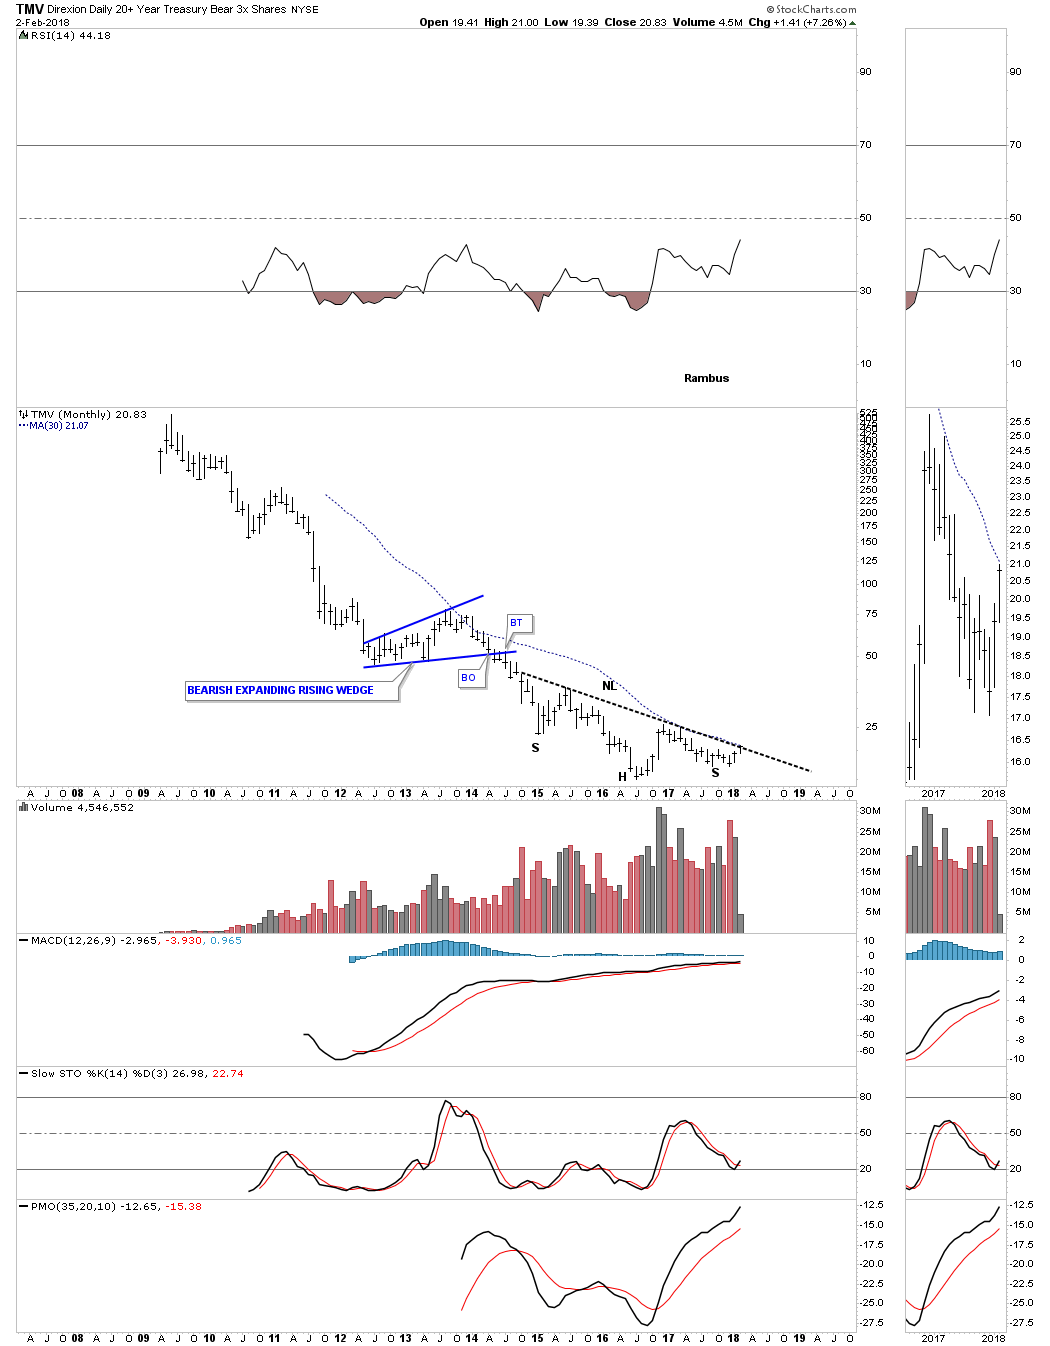
TMV monthly:
TMV 1-17-18 Update:
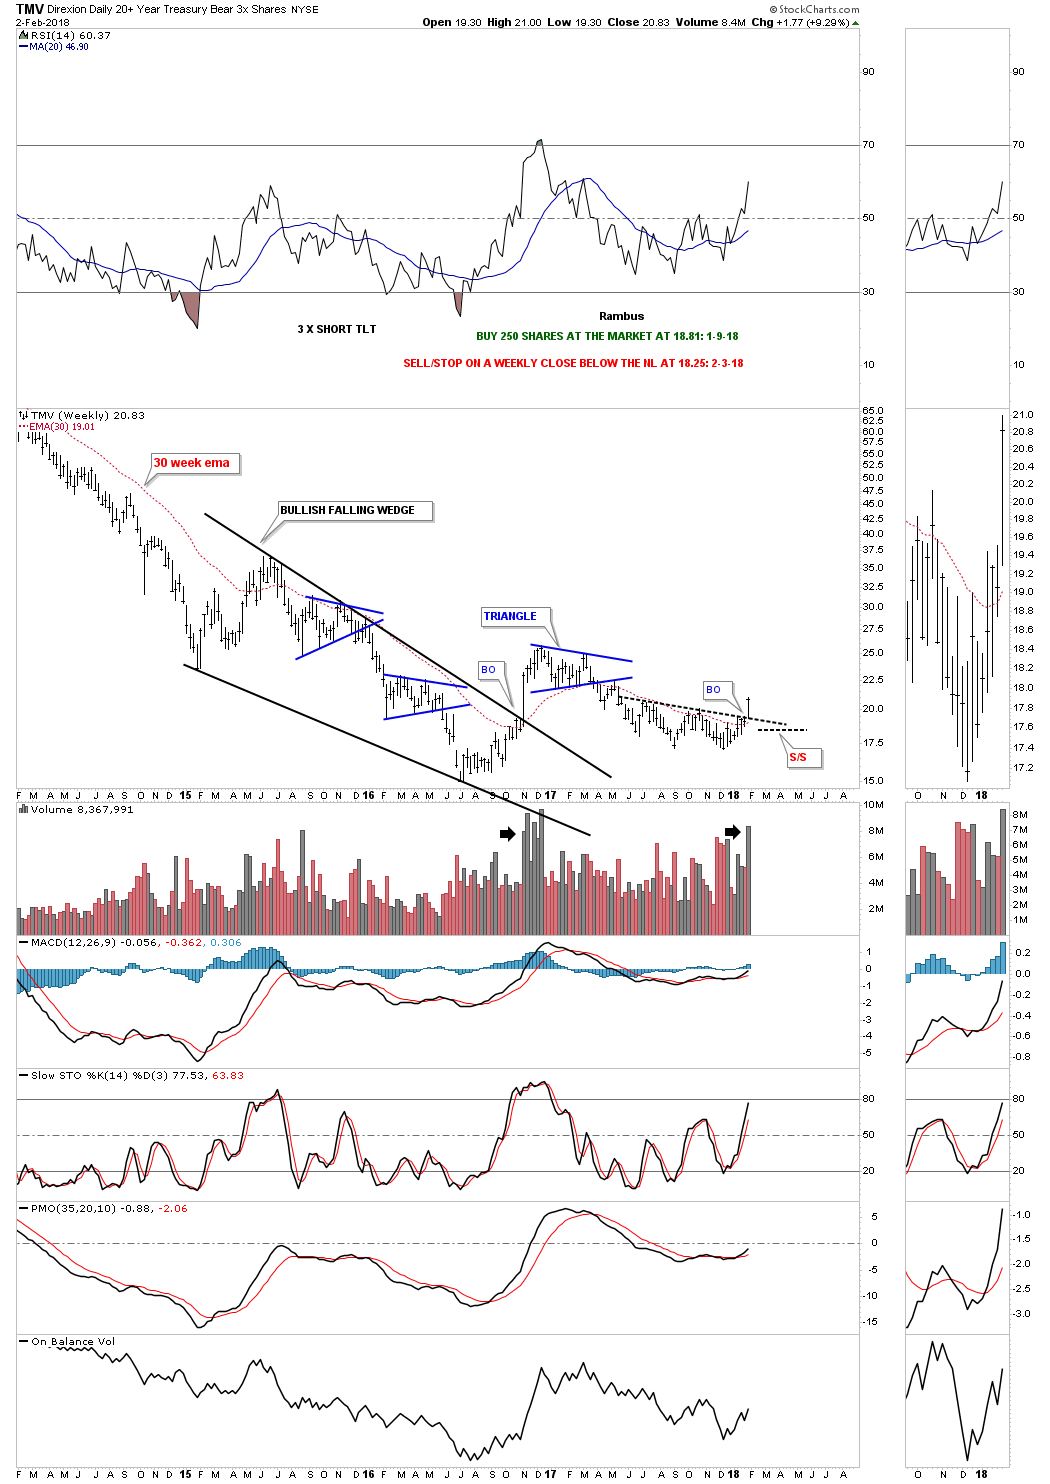
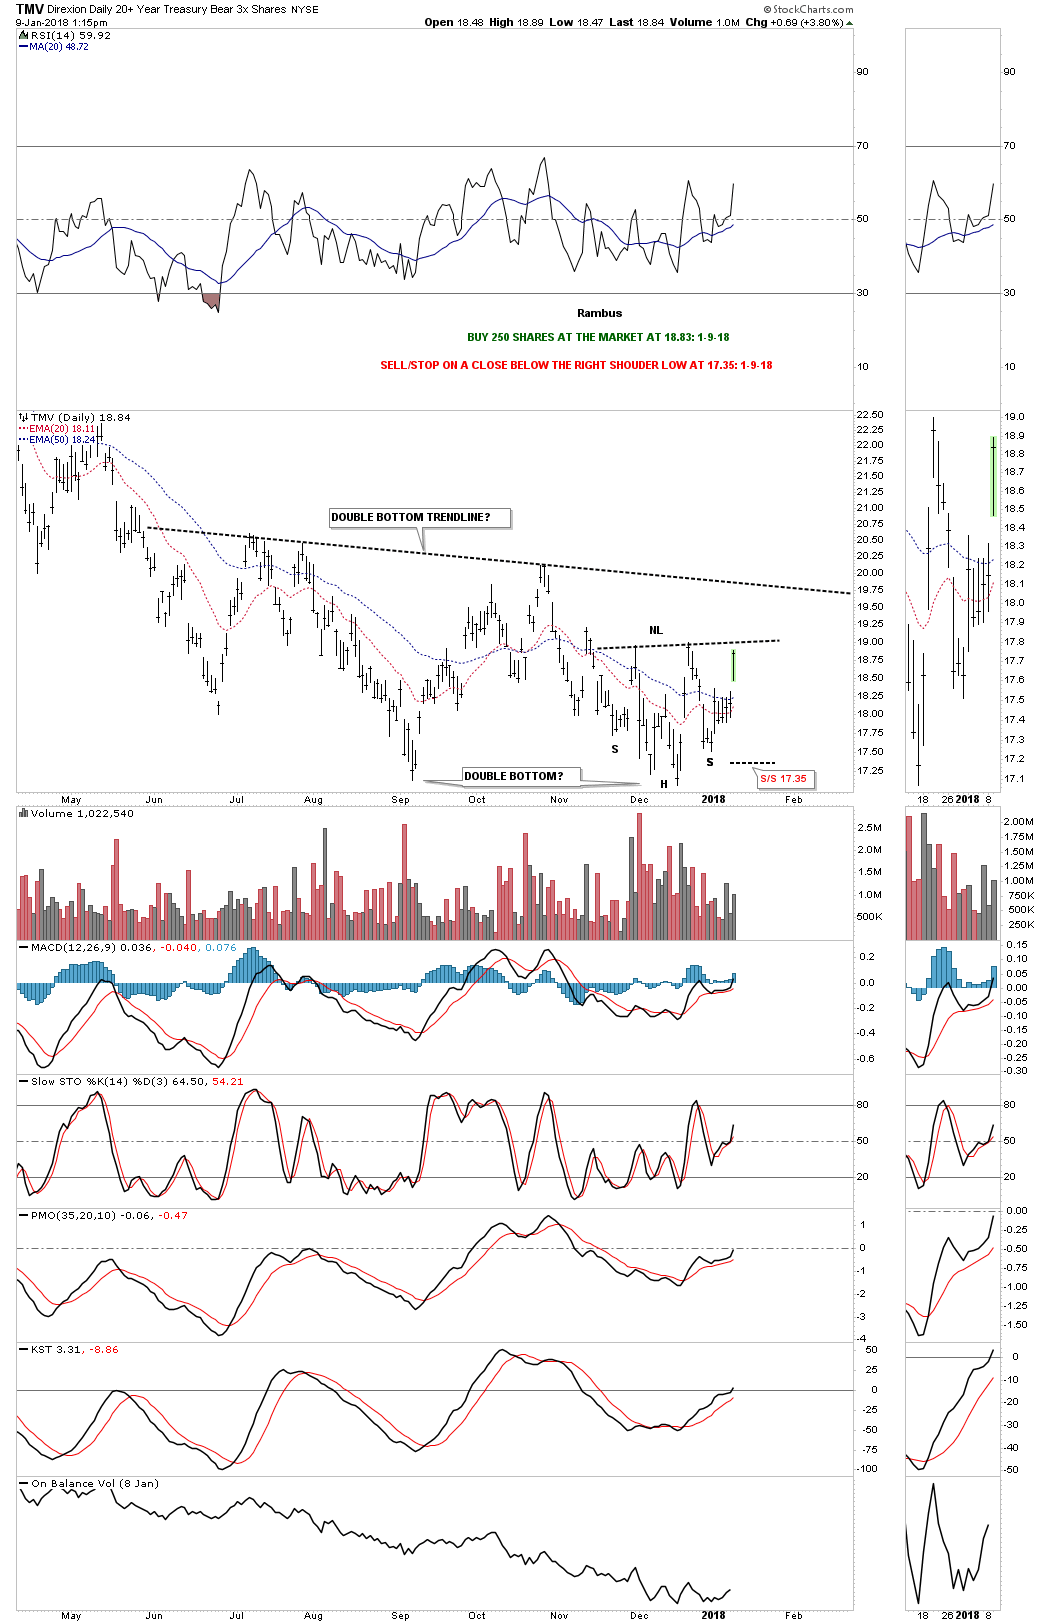
TMV is a 3 X short the TLT 20 year treasure bond etf. This trade is based on the TLT. For well over three years now the TLT has been building out what looks like a massive H&S top with the top of the right shoulder now in play. I’m going to take an initial position and buy 250 shares of TMV, 3 X short the TLT, at the market at 18.83 with the sell/stop on a daily close below the right shoulder low on the daily chart for the TMV at 17.35. I’m anticipating the the right shoulder high on the TLT will be the ultimate high. There will be several more entry points if this trades starts to workout.
A second buy point would be on the breakout above the neckline on the daily chart for the TMV. A third buy point would be on a breakout above the double bottom trendline.
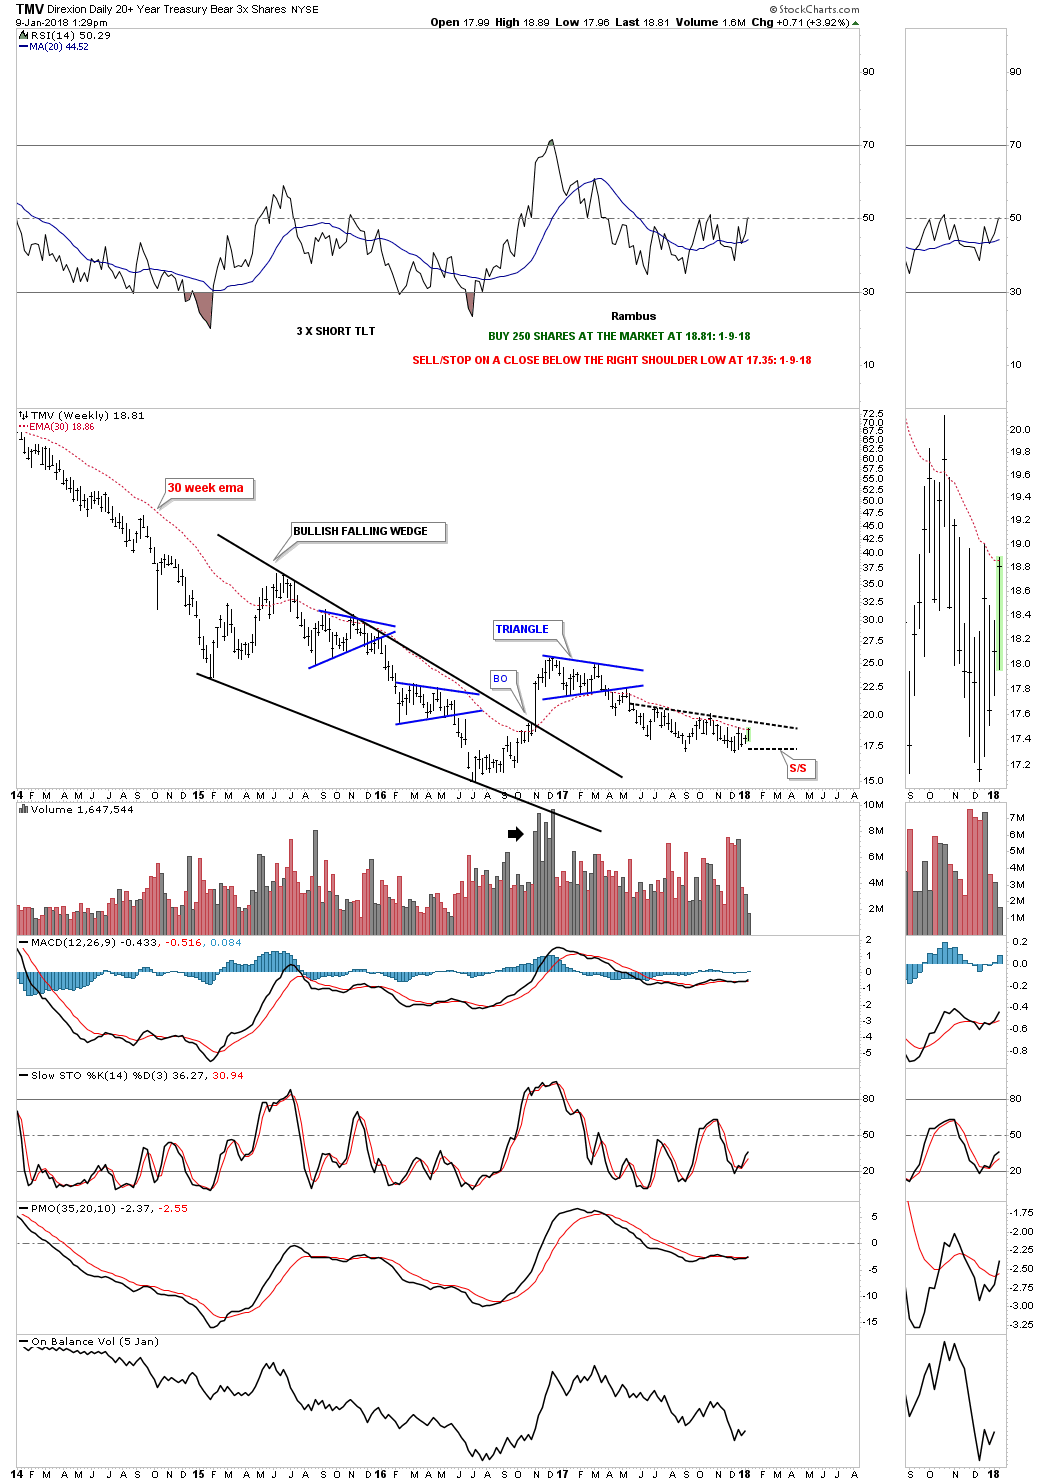
Below is the weekly chart for the TMV. The more conservative members may want to wait for the breakout above the double bottom trendline and the 30 week ema.
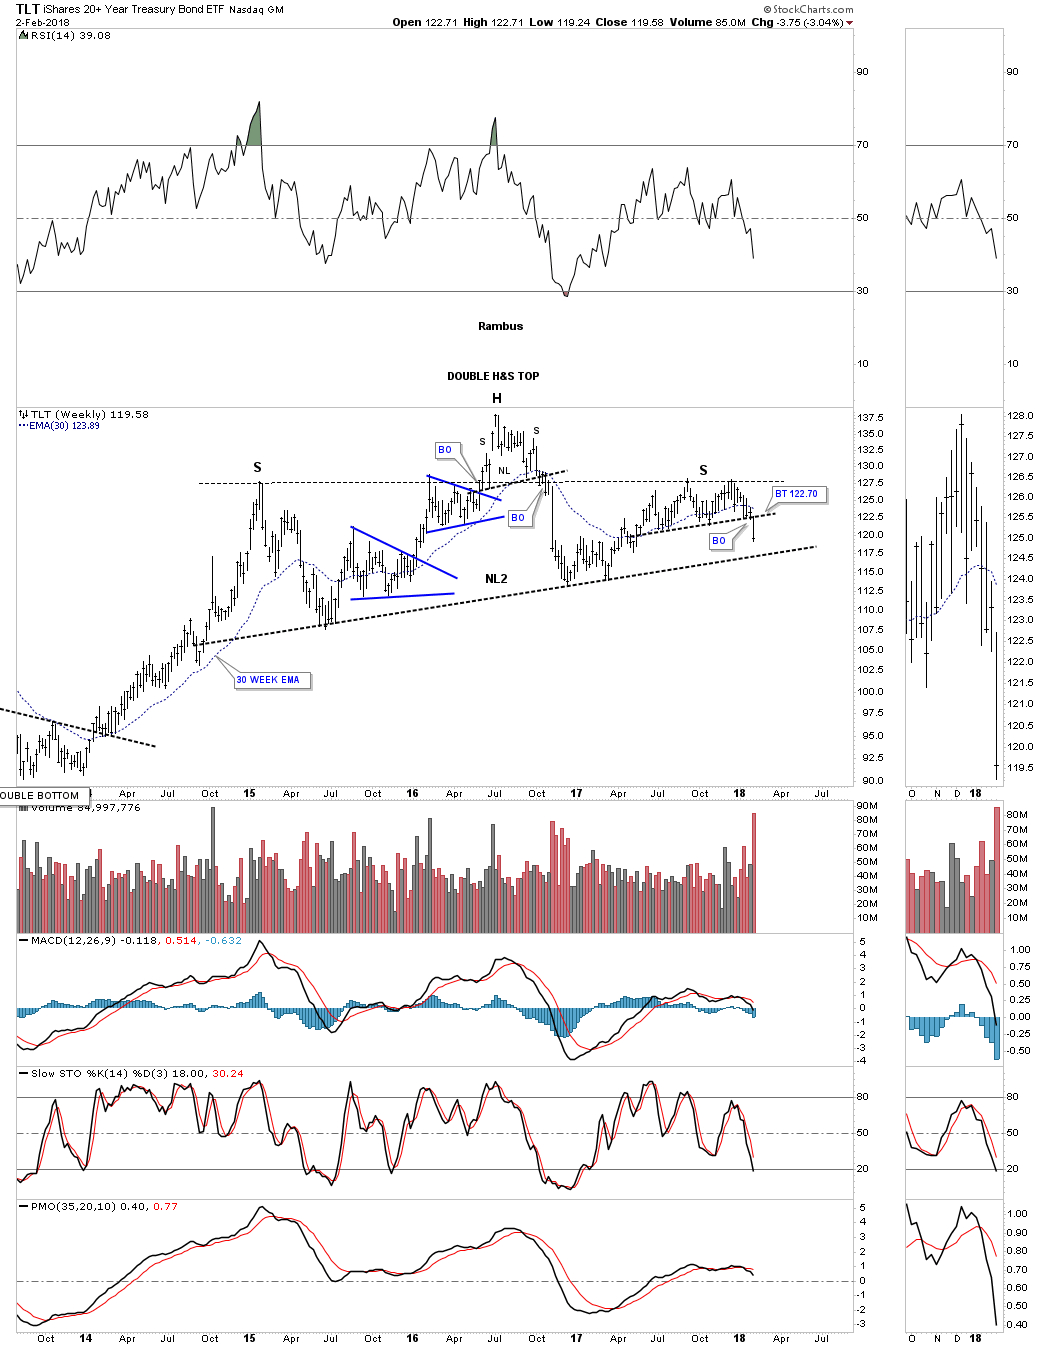
Below is a one year daily chart for the TLT which shows the possible double top right shoulder high that we’ll looked at on the weekly chart. Reverse symmetry may suggest we could see a small bounce off of the neckline as the 200 day ma is also intersecting the neckline.

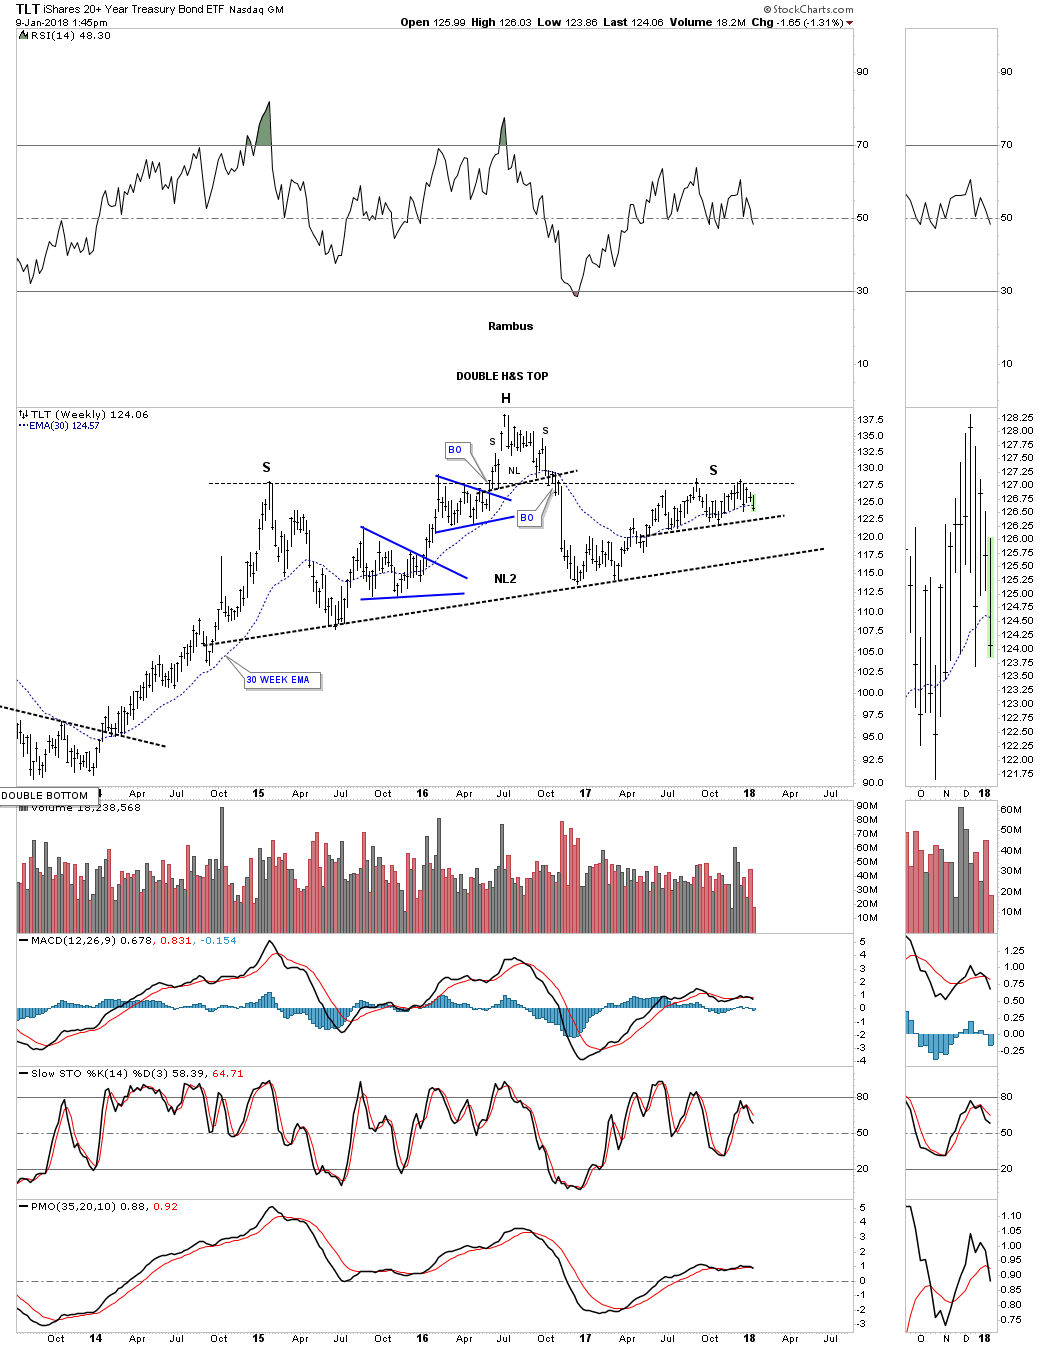
This next chart is a weekly look at the TLT which puts everything in perspective. There is some nice symmetry forming on this 3 plus year H&S top where both the left and right shoulder highs formed at the same high. This chart also shows you why I’m willing to take an initial position up here toward the possible right shoulder high.
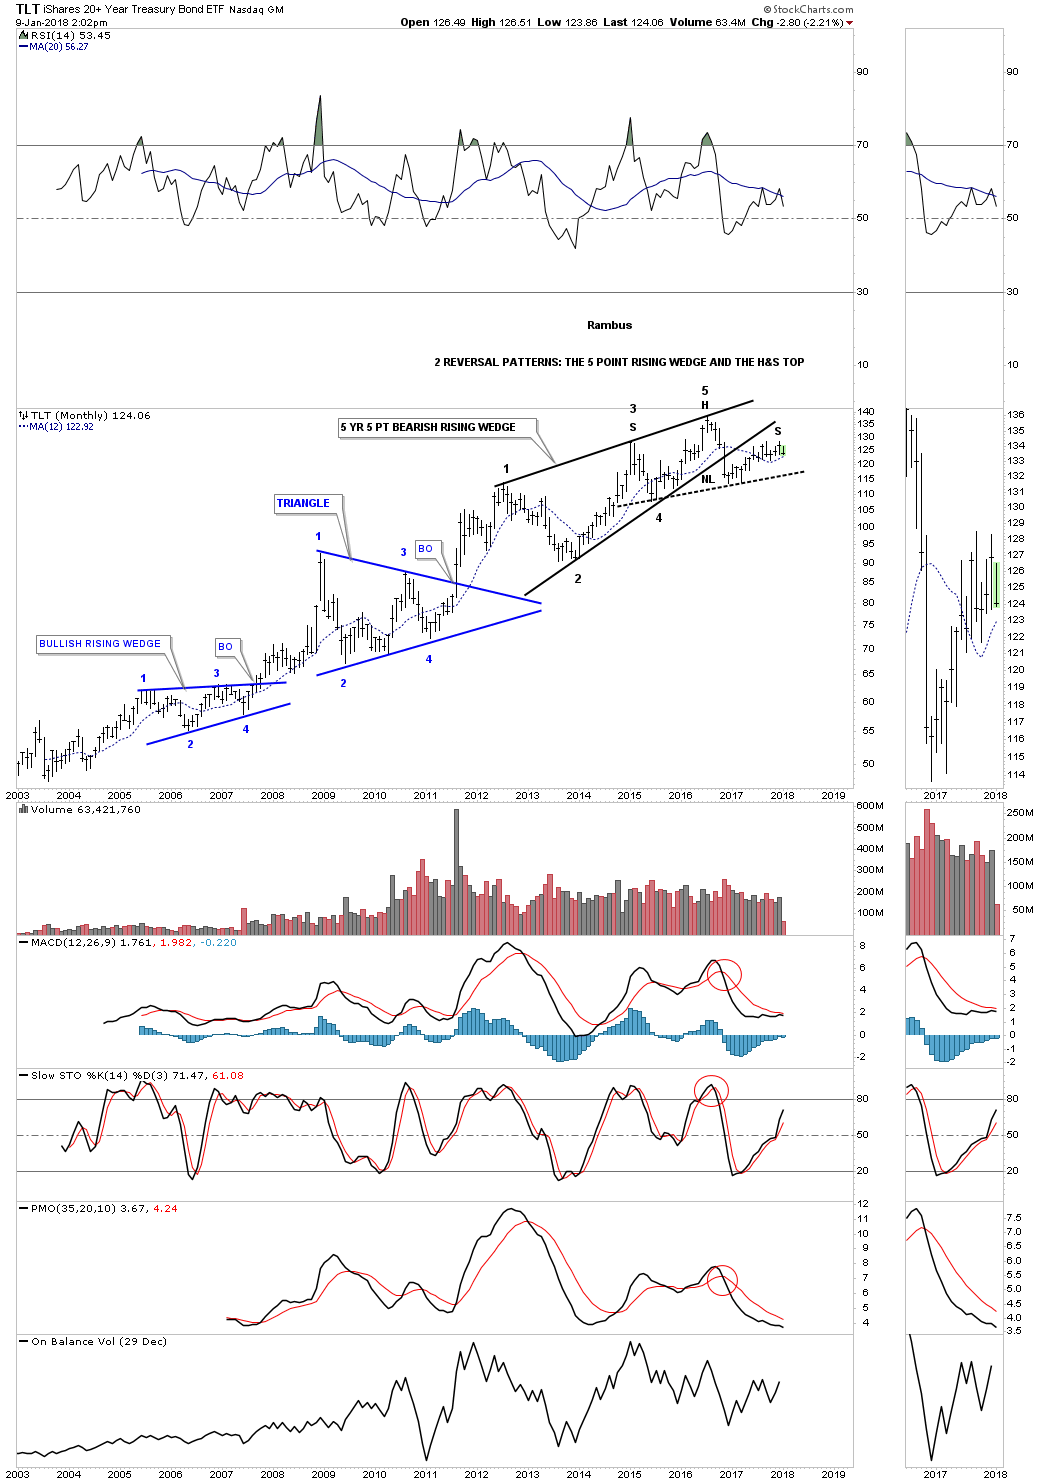
The long term monthly chart for the TLT is showing a possible classic H&S top building out. I’ve shown you many cases that a H&S pattern can buildout with the left shoulder and head forming inside of a wedge pattern, in this case the 5 year 5 point bearish rising wedge with the right shoulder forming on the backtest to the underside of the bottom rail. TLT has fallen just shy of a complete backtest to the bottom rail, but in this case it looks close enough. As you can see my entry point is very early if this very large H&S top plays out. There will be several more good entry points if things start playing as these charts are suggesting. We basically have two separate reversal patterns forming in the same location.