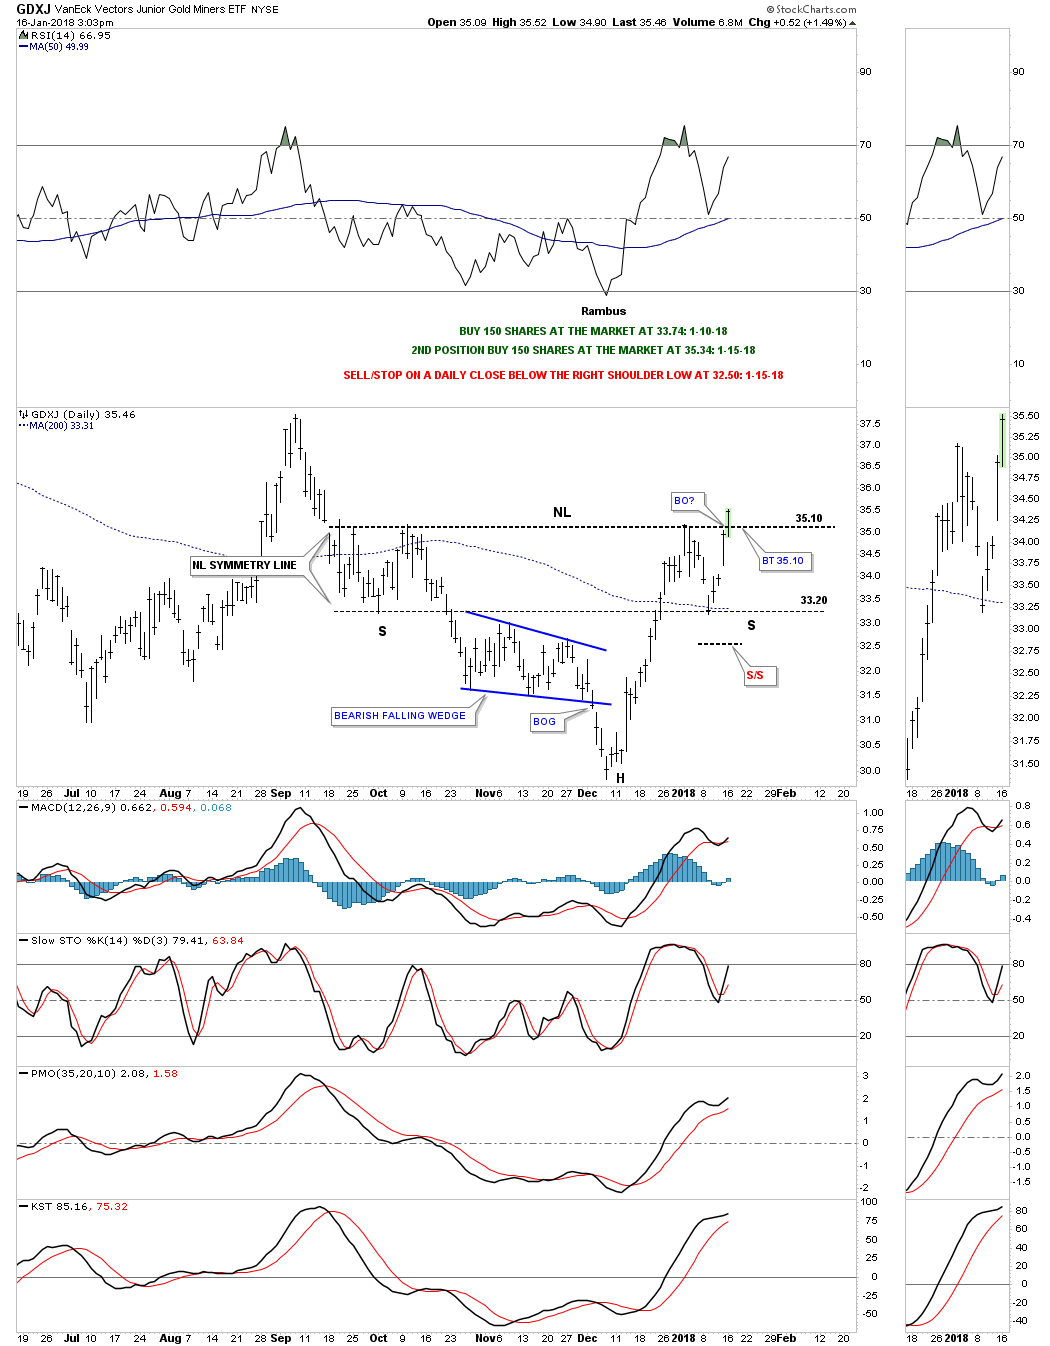
Today the GDXJ is breaking out above its neckline. Again I was looking for a little more chopping action between the neckline and the neckline symmetry line before the breakout, but so far it’s not happening. I’m going to take my second position and buy 150 shares at the market at 35.34 with the sell/stop at 33.31 for now. A backtest to the neckline would come in around the 35.10 for a slightly lower risk entry point.
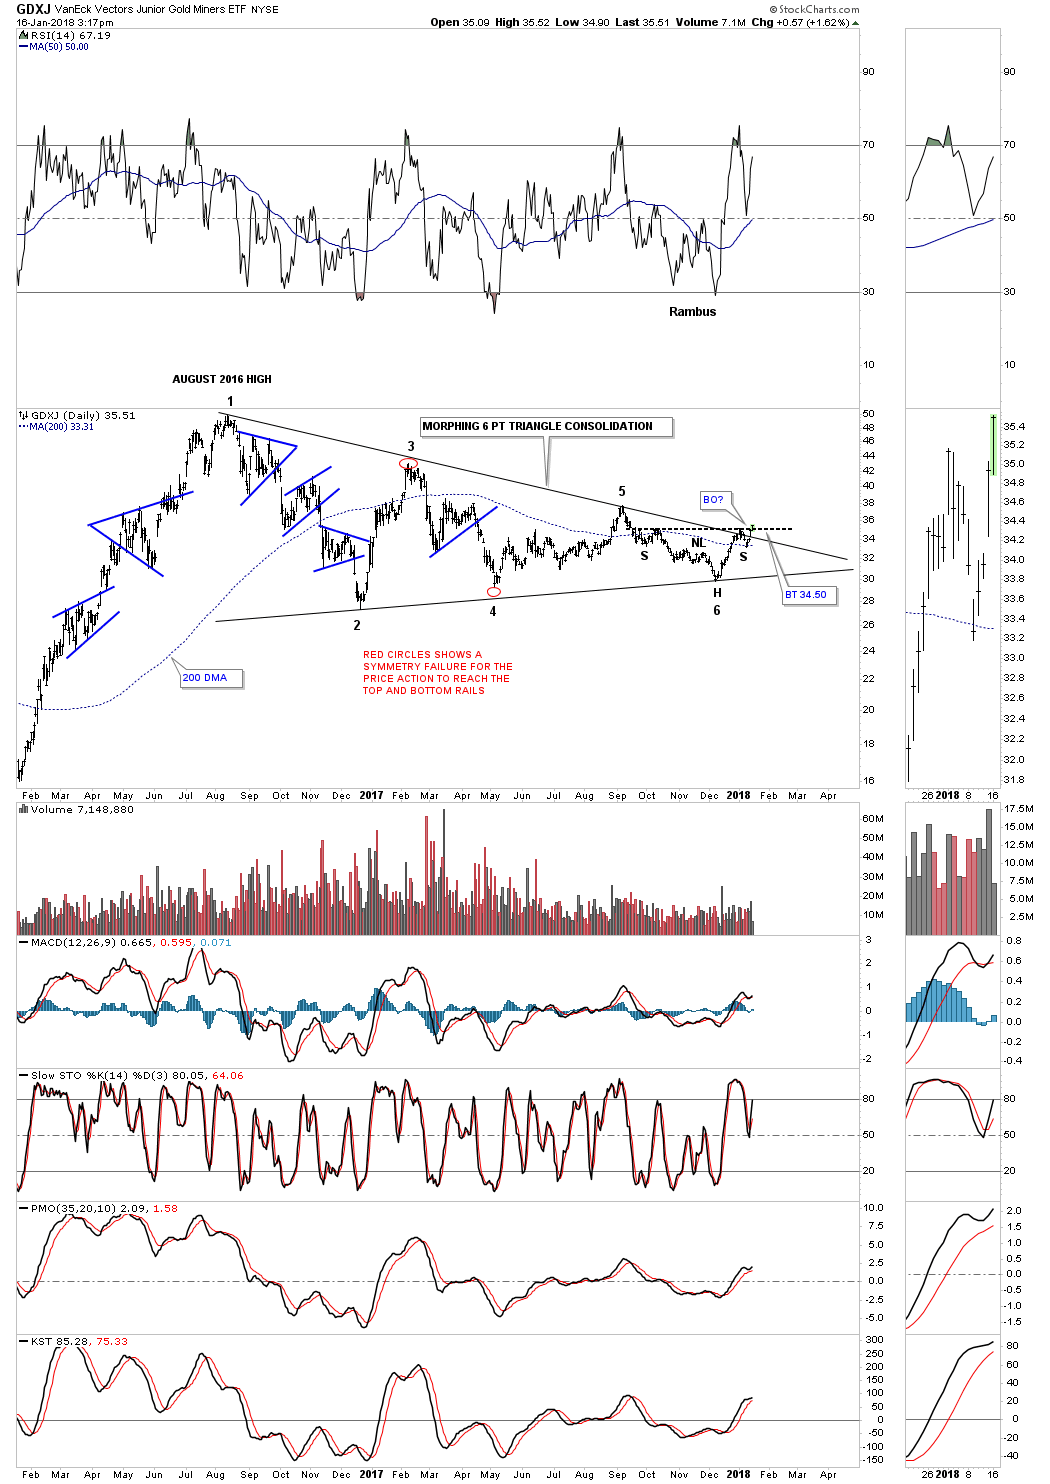
Below is a longer term daily chart which shows the price action since the August 2016 high as a big morphing triangle consolidation pattern as shown by the red circles. The 6th reversal point has formed the H&S bottom which we’ve seen in other big consideration patterns is generally a very bullish setup.