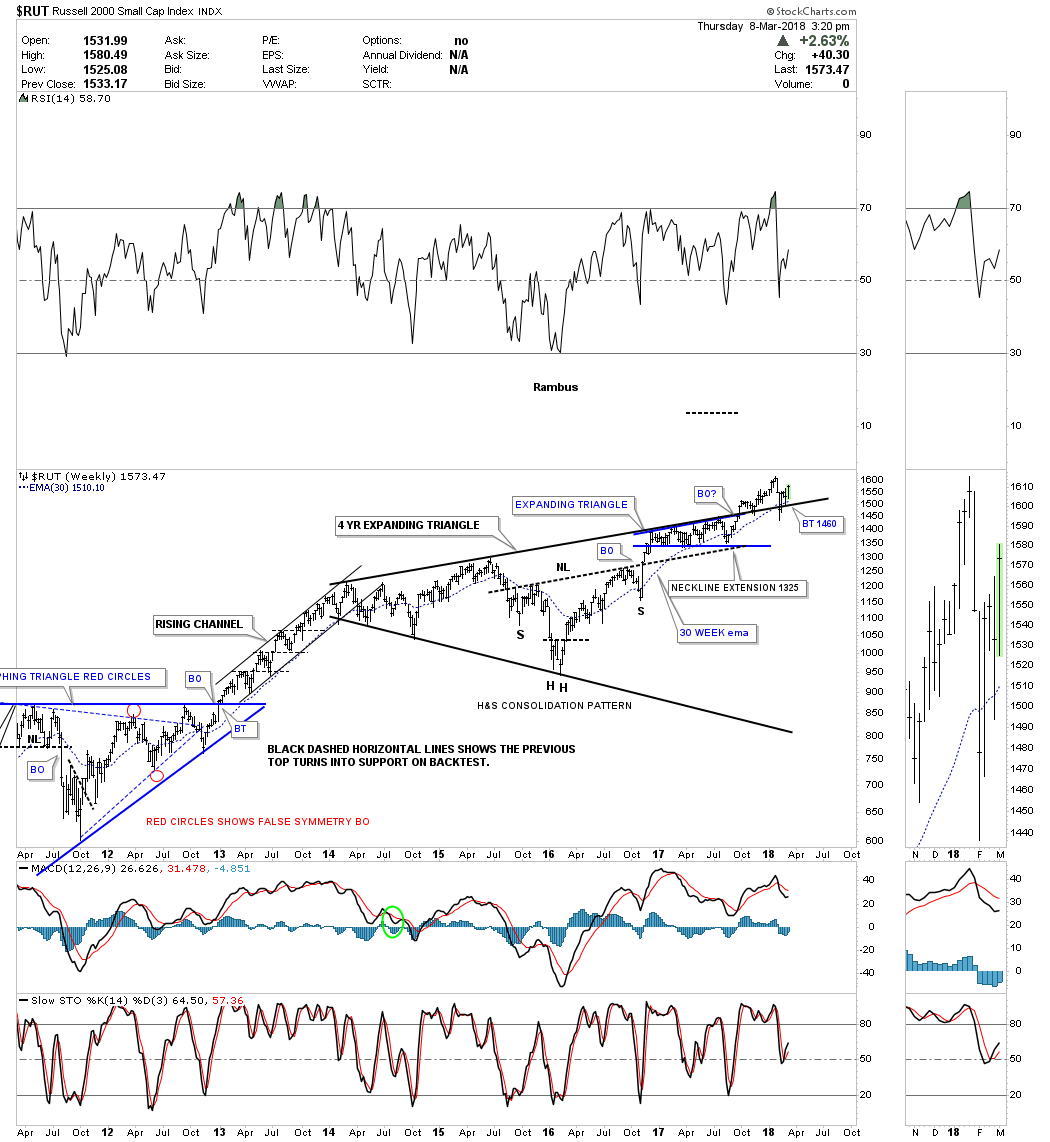
You may have noticed that the RUT 2000 small cap index has been fairly strong recently on a relative basis. This may be due to the fact that it has been in breakout and backtest mode for the last six months or so. Below is a long term weekly chart which shows the four year black expanding triangle consolidation pattern we’ve been following with the breakout and backtest taking place. The backtest to the top rail was a little hard, but it did hold support. You can also see the smaller blue flat bottom expanding triangle that formed just below the four year top rail.
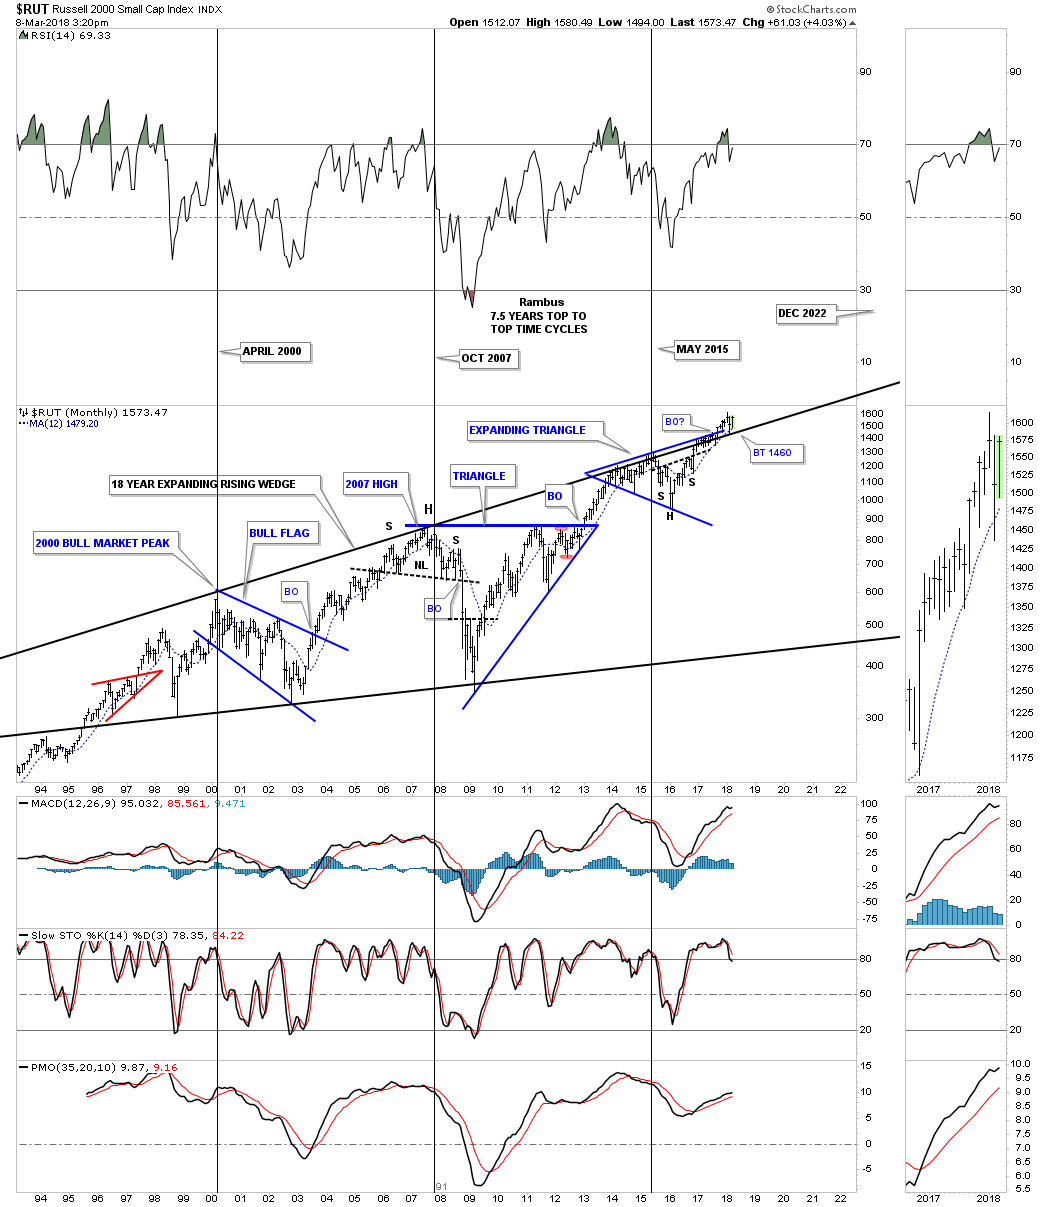
This very long term monthly chart shows an even bigger consolidation pattern that goes all the way back to 2000, the 18 year bullish expanding rising wedge. The last time we looked at this chart I suggested one of the reasons the RUT had been weaker on a relative basis is because of all the overhead resistance it had to overcome to break free. The impulse move may be at hand.
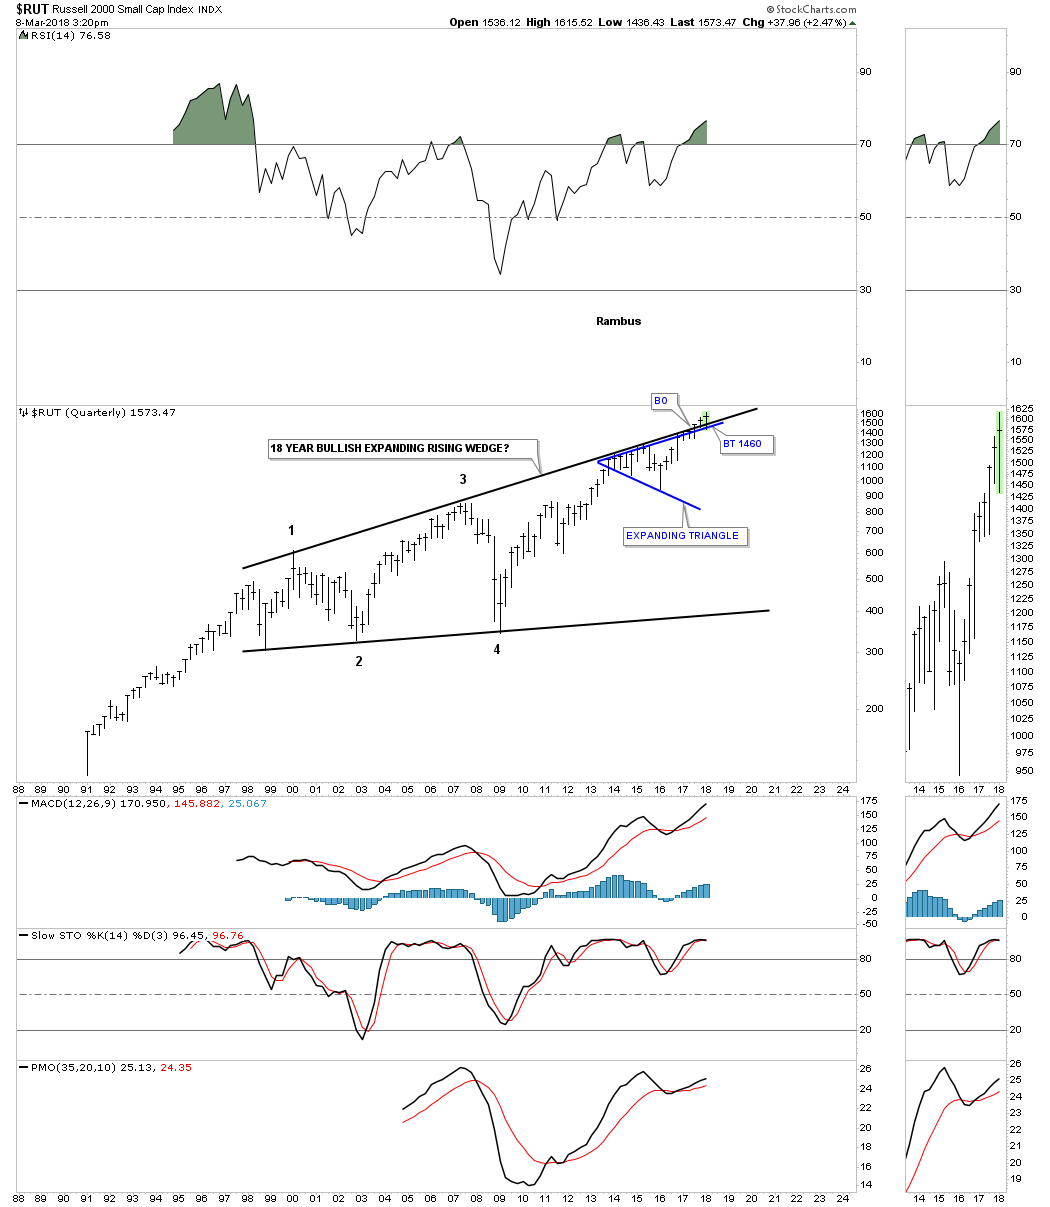
The quarterly chart shows the 18 year bullish expanding rising wedge all by itself. It’s always nice to see the small caps do well durning a rally phase in the stock markets.