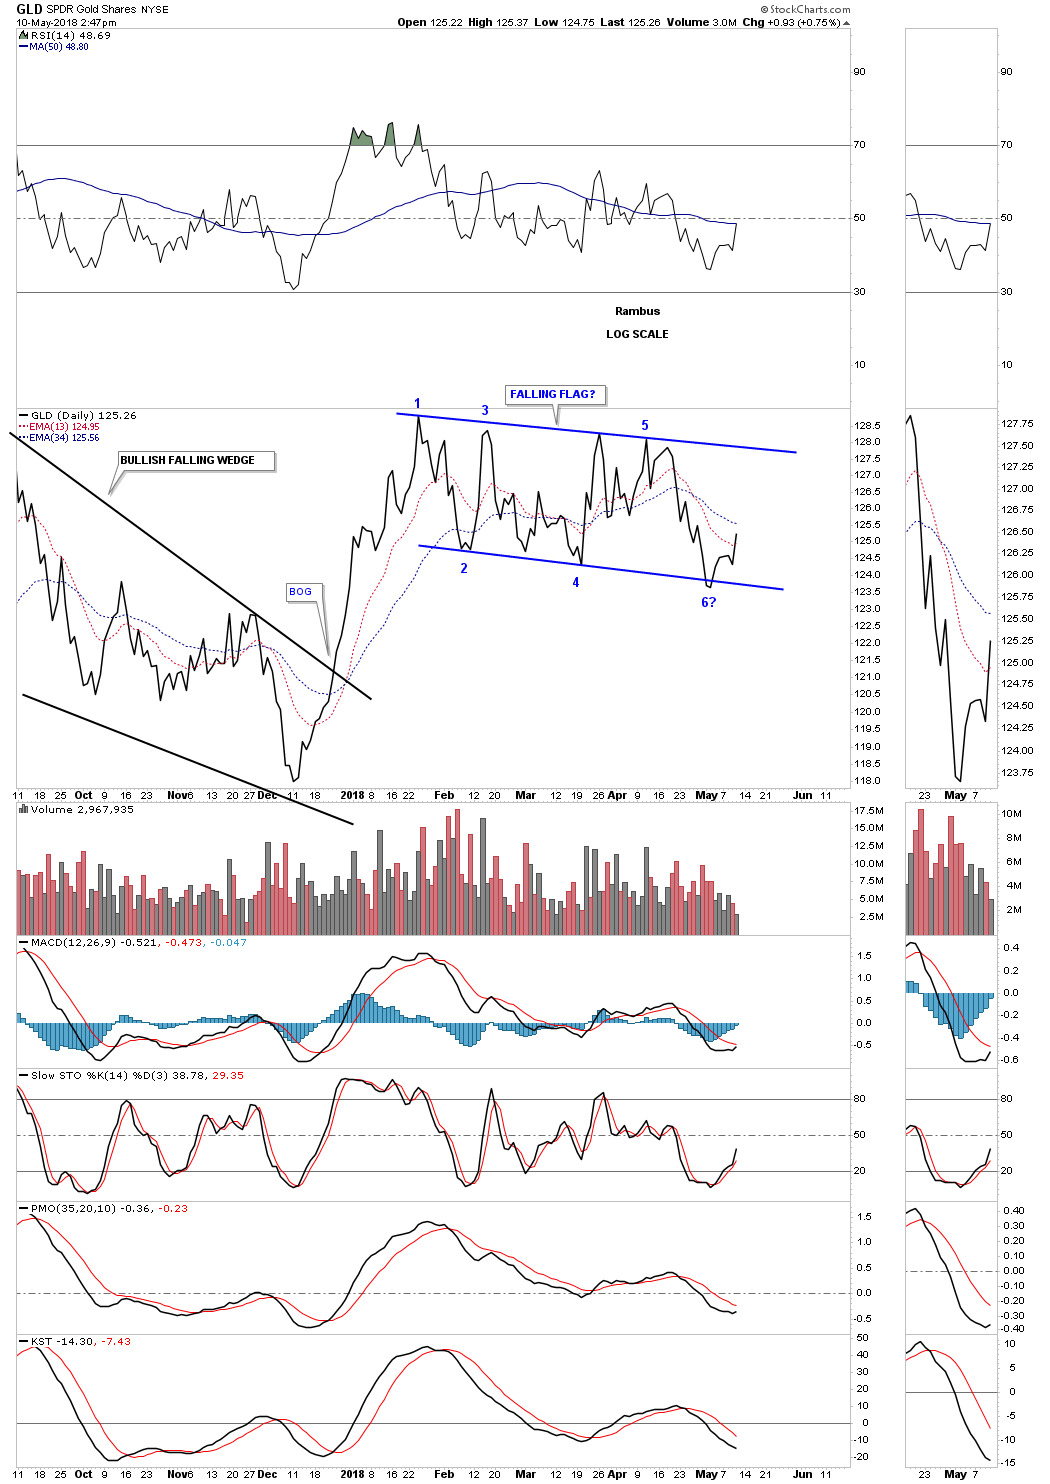
This first chart is a daily line chart for GLD which shows it has completed 5 reversal points so far and is working on the all important 6th reversal point back up to the top rail. This is where the bulls need to step up to the plate.
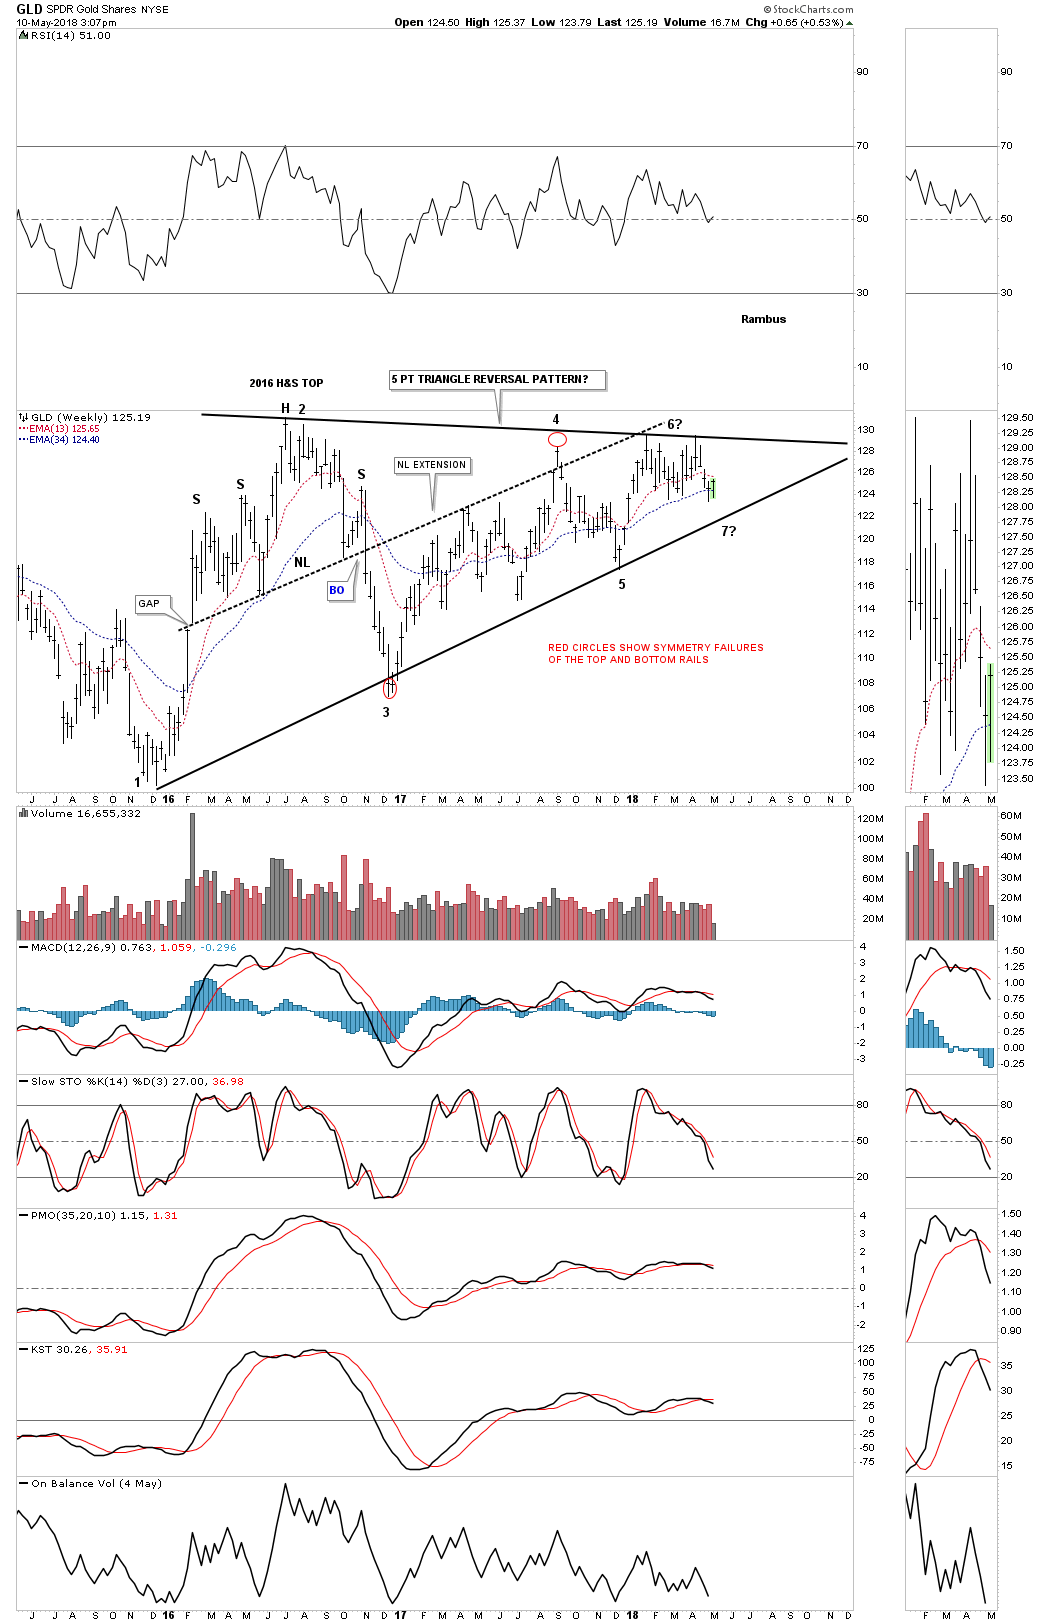
The weekly chart below shows the 2 1/2 year triangle that has been building out with 5 completed reversal points so far. A touch of the bottom rail will complete the 6th reversal point creating a consolidation pattern. If the bottom rail is hit the bulls will need to hold support to create a 7th reversal point throwing the triangle back into the reversal category.
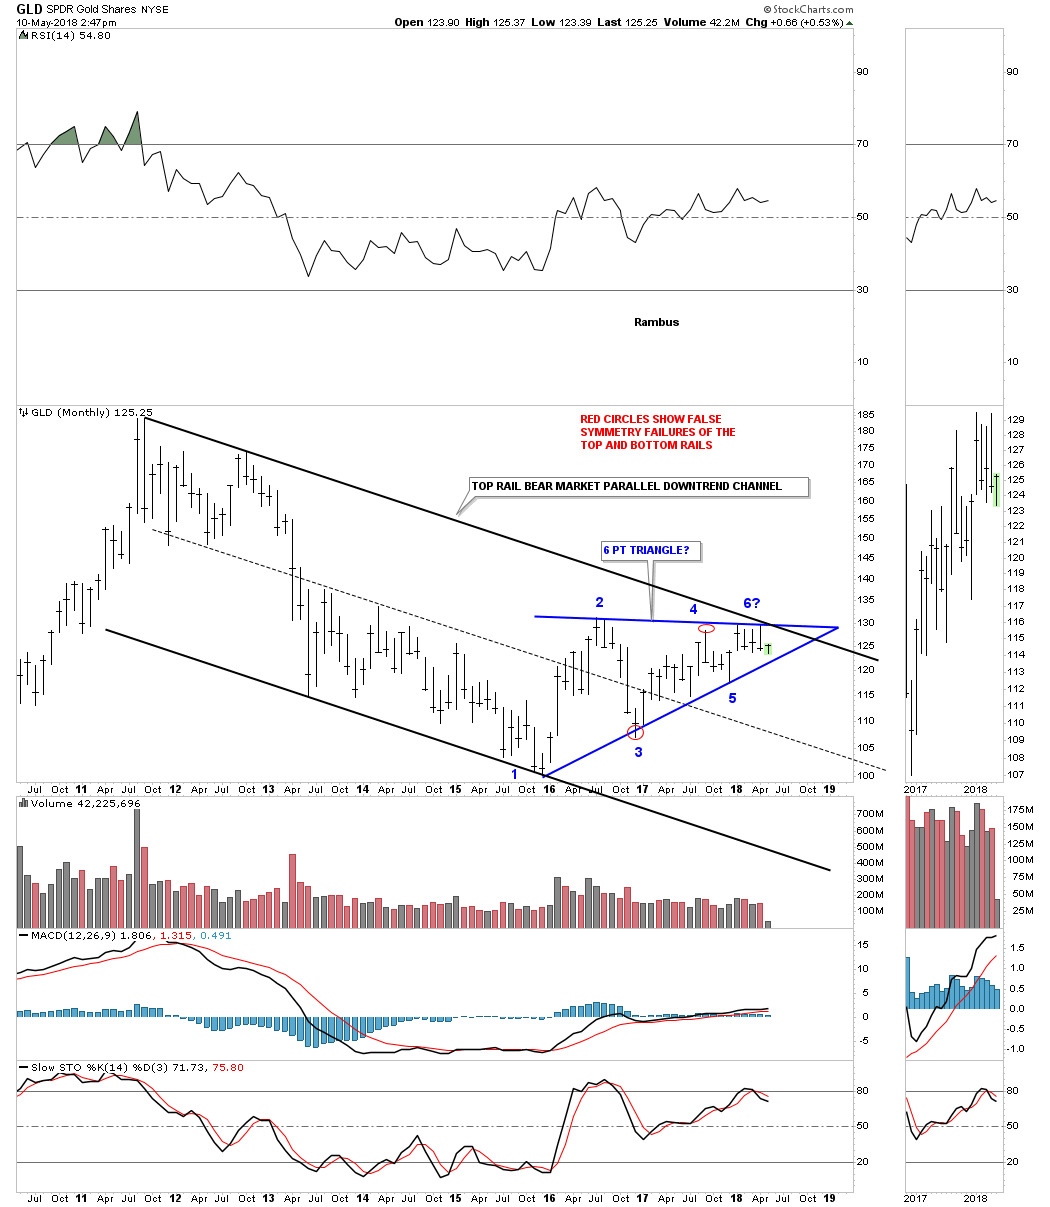
The long term monthly chart shows the bear market downtrend channel with the 2 1/2 year triangle.
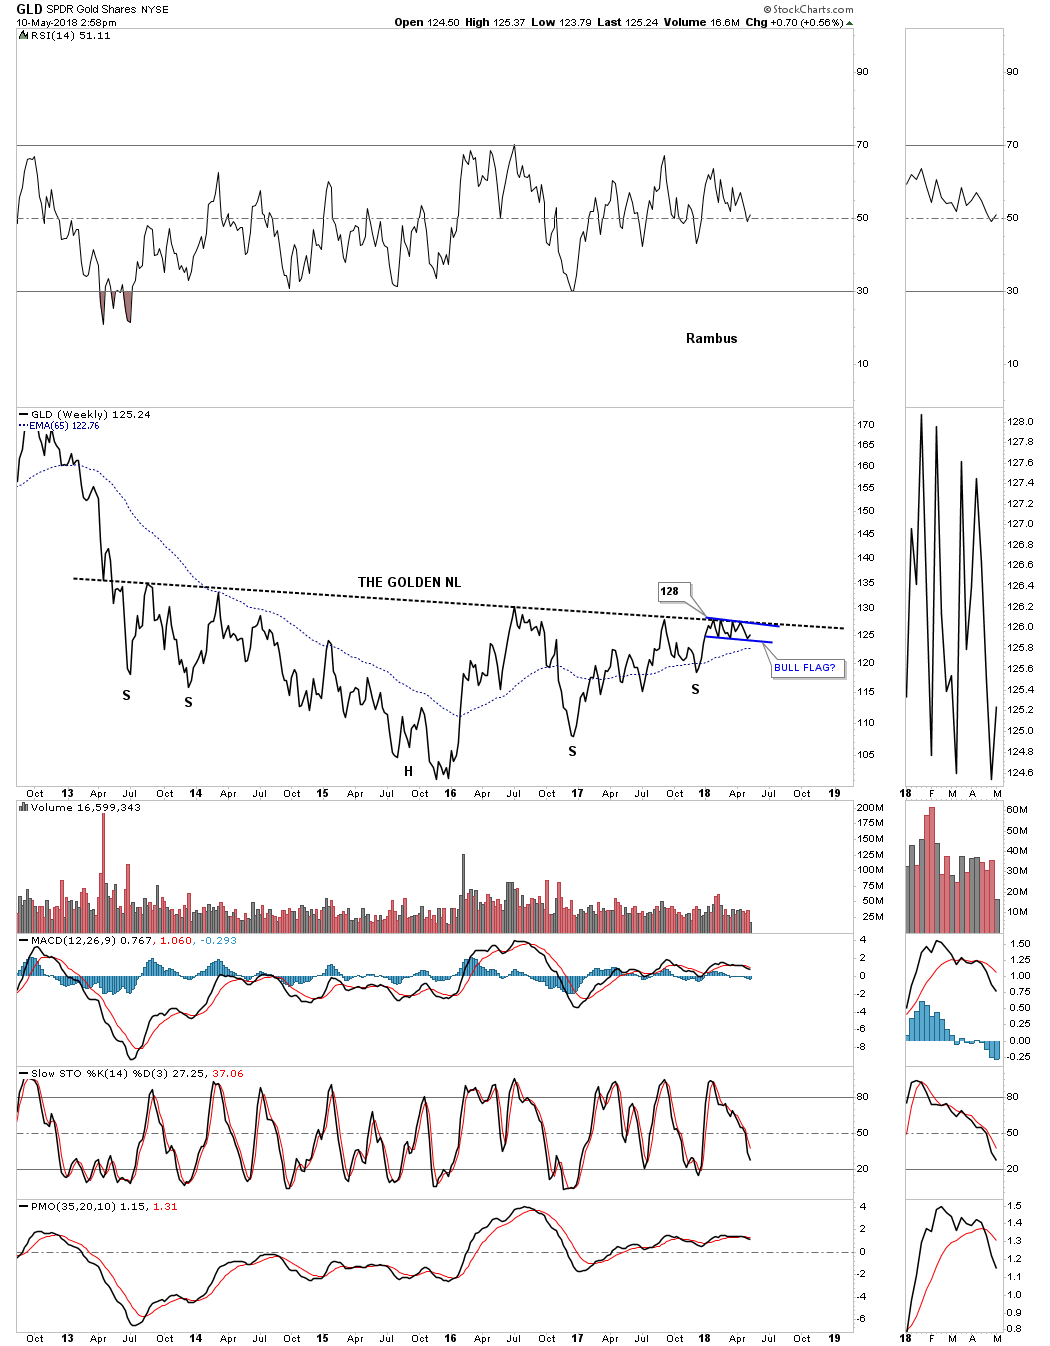
This last chart for GLD is showing the possible 5 year H&S bottom with the golden neckline. That little blue flag which is forming just below the neckline is keeping everyone in suspense waiting for a resolution. This is a massively large pattern that will lead to a very big move if the H&S bottom plays out. It seems pretty obvious that the breakout will be to the upside, but stranger things have happened in the markets before. So close but yet so far away. There will be plenty of time to board the train if the H&S bottom completes.