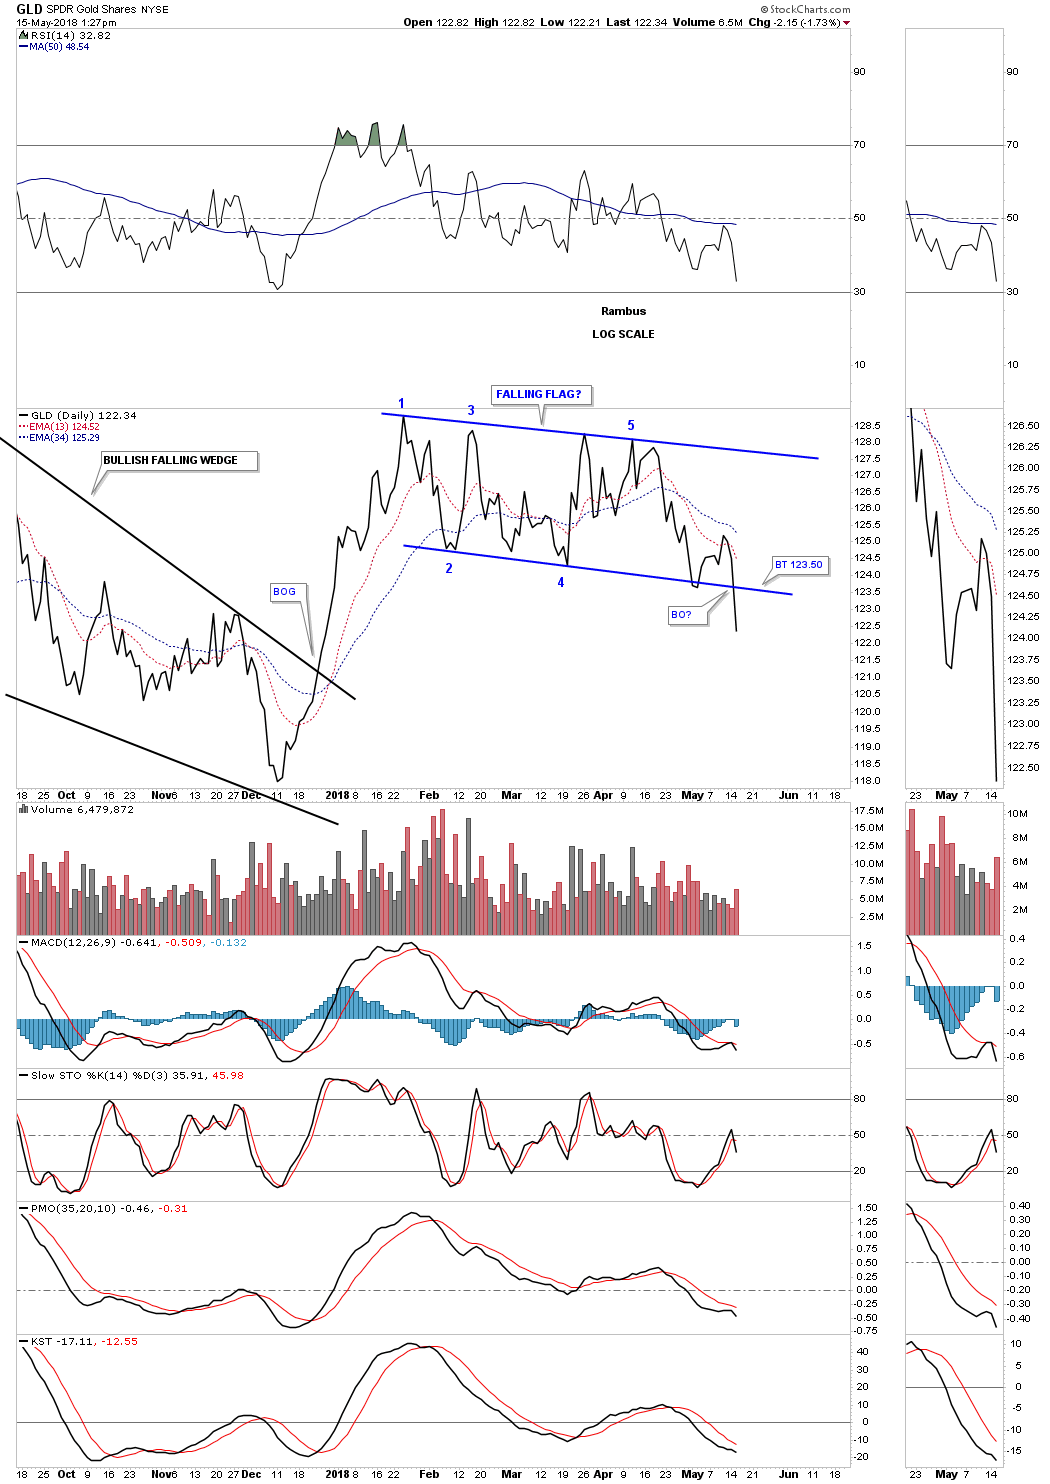
Today GLD is breaking below the bottom rail of its 5 point falling wedge which is suggesting the four month trading range is a top. The day isn’t over yet, but if the price action closes below the bottom rail the breakout will be confirmed.
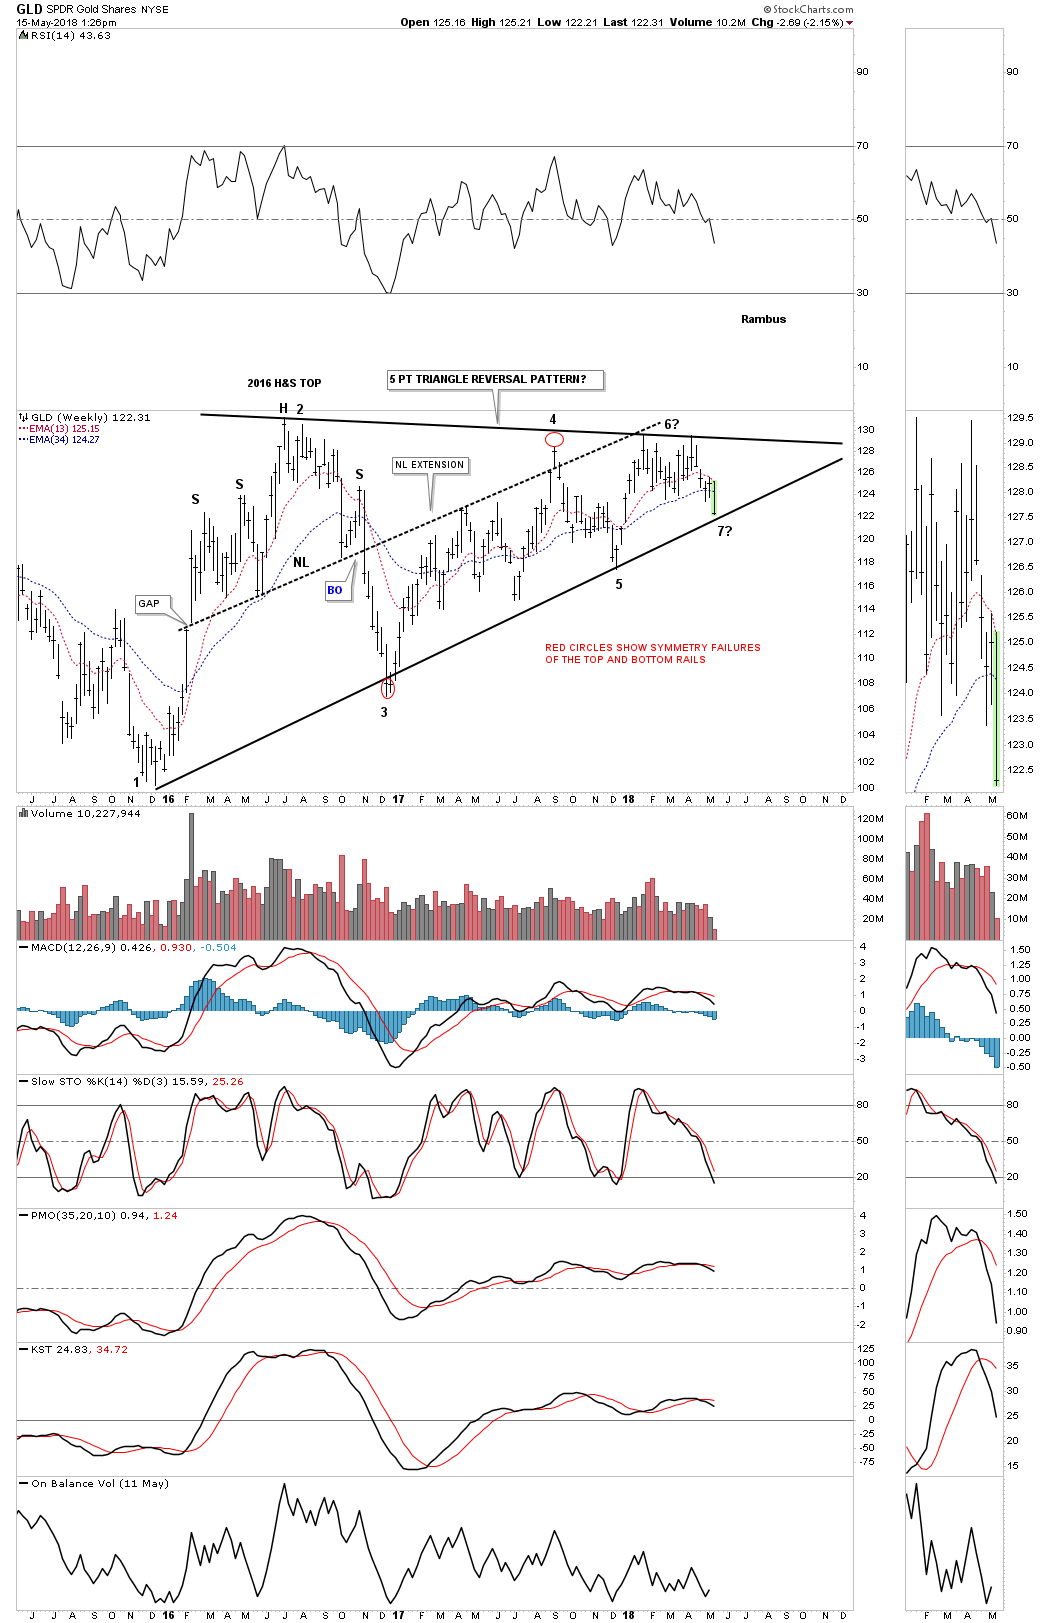
The weekly chart shows GLD coming in to critical support at the bottom rail of its 2 1/2 year triangle formation. A touch of the bottom rail will complete the 6th reversal point suggesting the triangle is consolidation pattern to the downside. The bulls need to hold support at the 7th reversal point to create a seven point triangle reversal pattern to the upside.
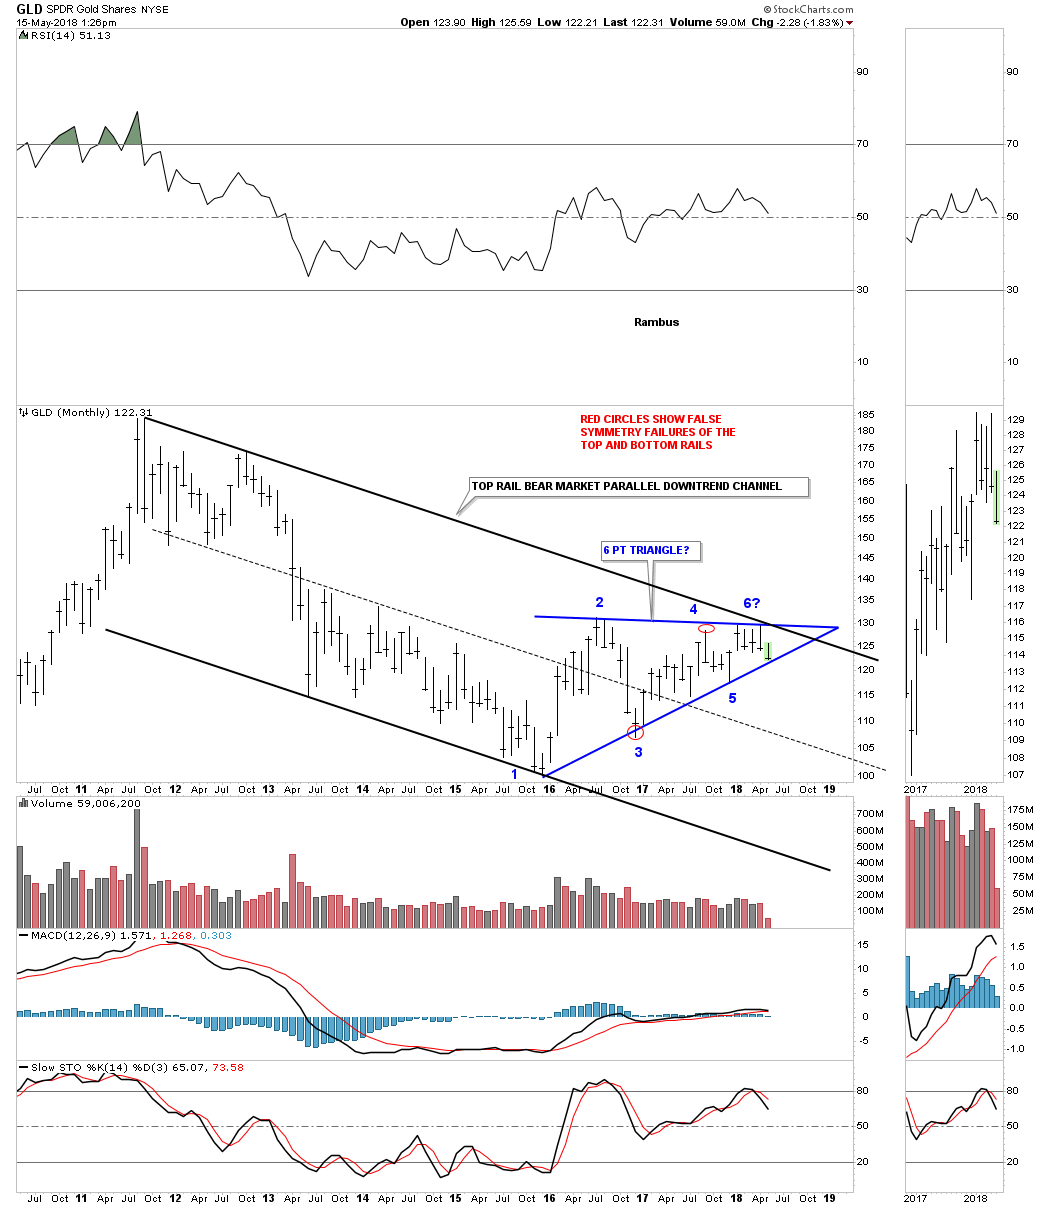
Below is the monthly chart showing the 2011 bear market downtrend channel with the two and a half year triangle trading between the top and bottom rails.
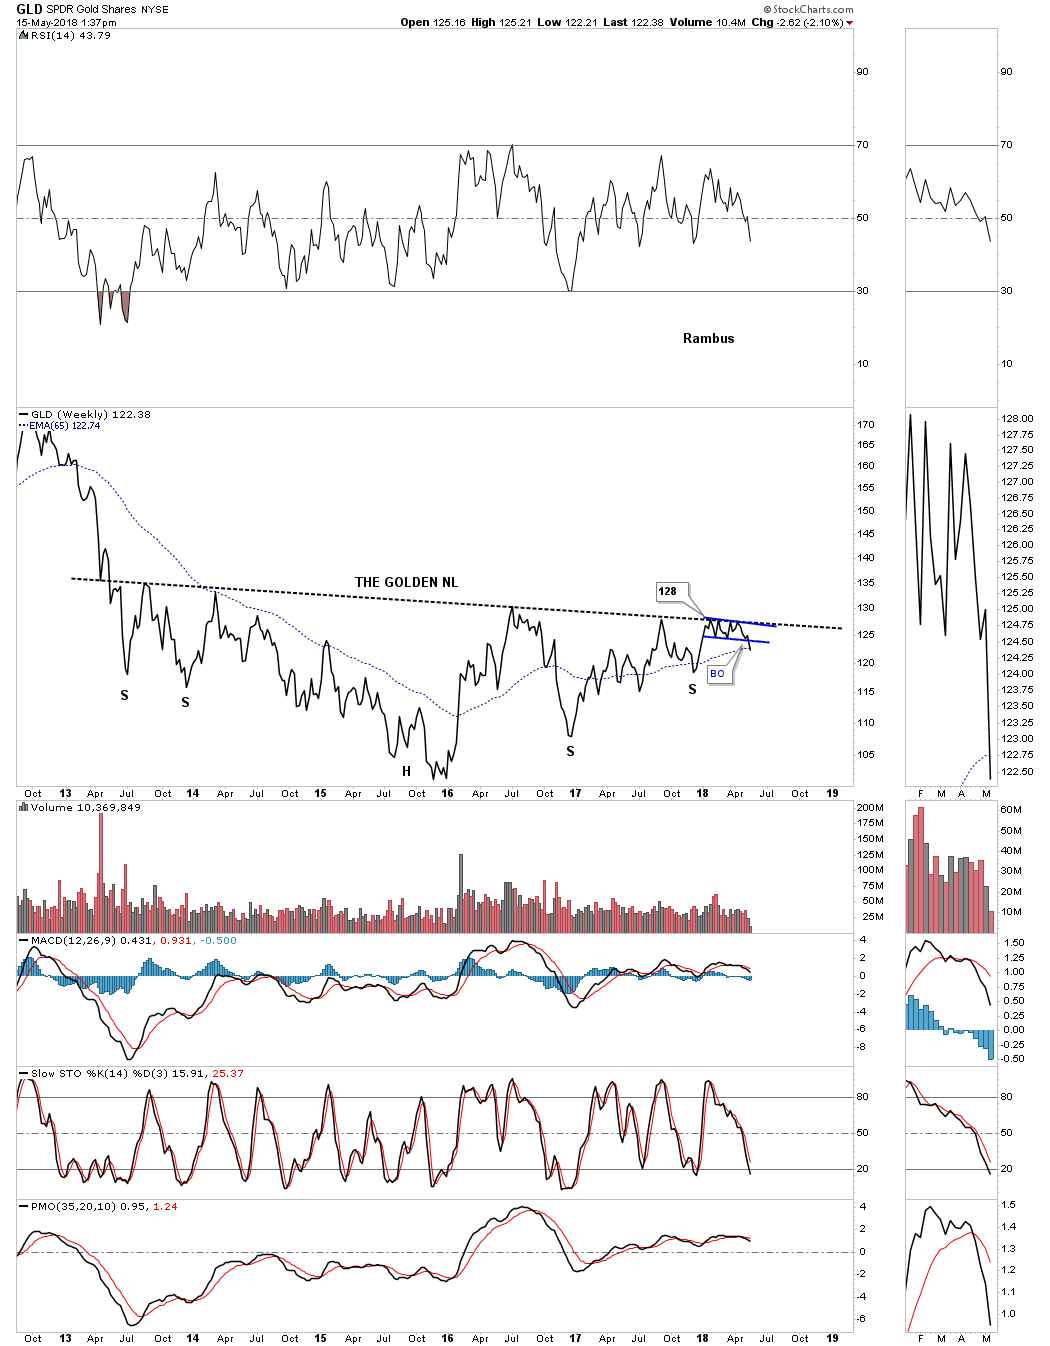
This chart is everyones favorite chart for GLD which shows its potential five year H&S base which everyone and their brother-in-law sees. The golden neckline is still holding resistance regardless of all the reasons gold needs to move higher.


