Last week we looked at this rectangle trading range that was building out on the Transportation Average. Today the price action is in the process of trying to breakout above the top rail. Today’s rally has also completed the 5th reversal point making this rectangle a reversal pattern to the upside. Since this rectangle formed below the previous high we needed to see a reversal pattern, with an odd number of reversal points, to reverse the small move down.
![]()
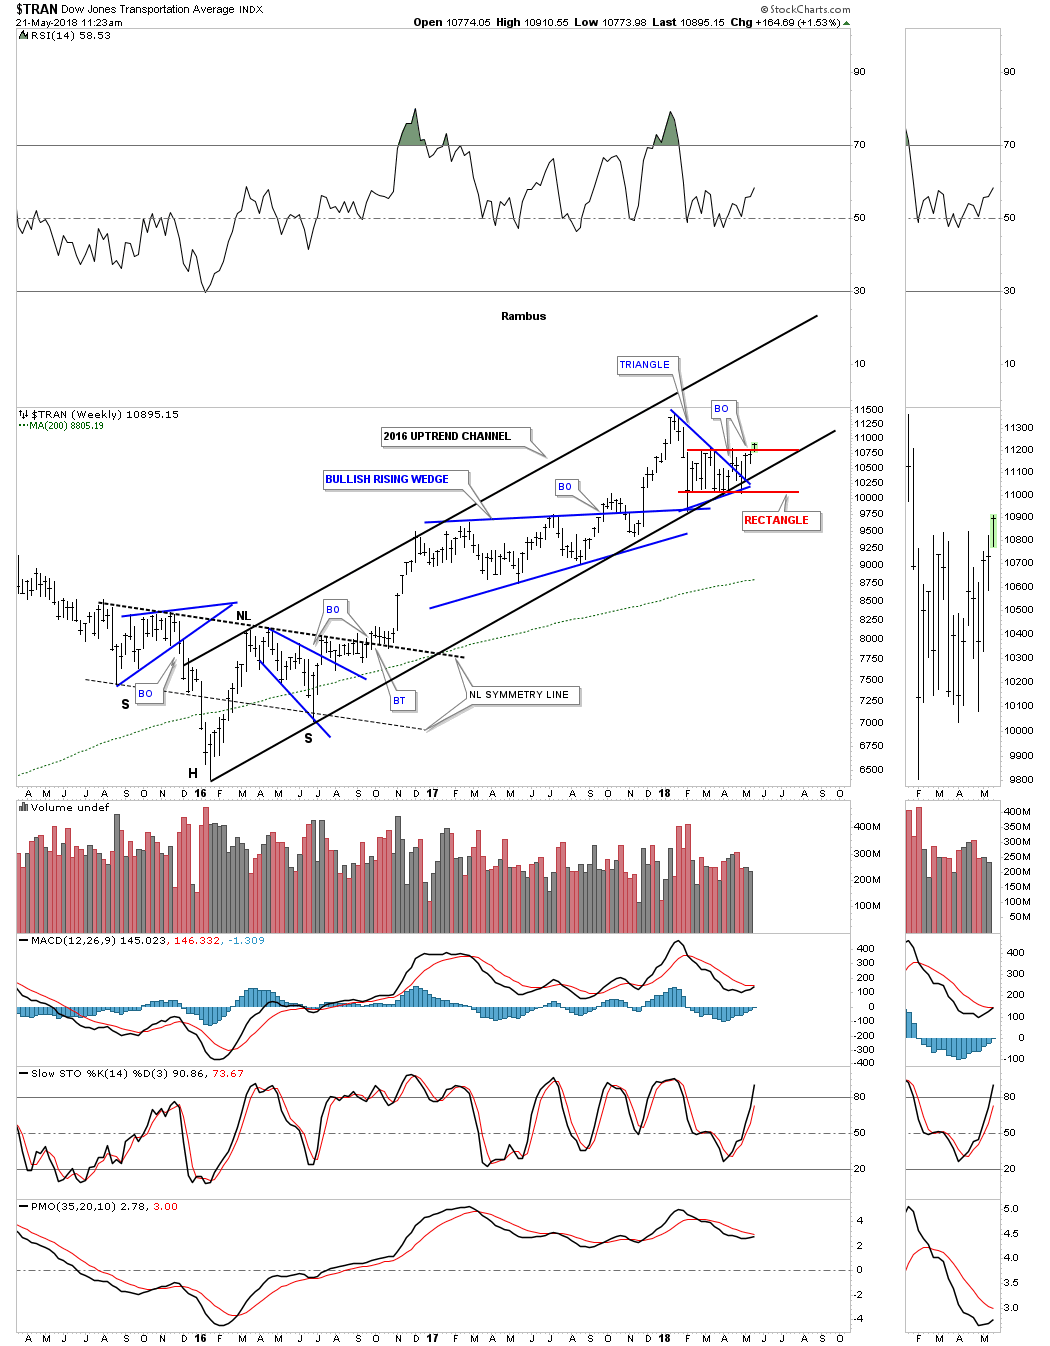
We’ve also been following this long term weekly chart which is showing some beautiful Chartology starting with the very symmetrical H&S bottom with the head forming at the 2016 low that started the 2016 uptrend channel. In 2017 the Transportation Average built out the bullish rising wedge which broke out to the upside. Since January of this year the Transportation average has been experiencing a correction or consolidation phase. There are two distinct patterns you can see. The first one is the blue triangle which has formed on the bottom rail of the 2016 uptrend channel. The second pattern is the red 5 point rectangle reversal pattern which also has formed on the bottom rail of the 2016 uptrend channel. IYT is a 1 X long etf if anyone is interested in trading the Transportation Average.