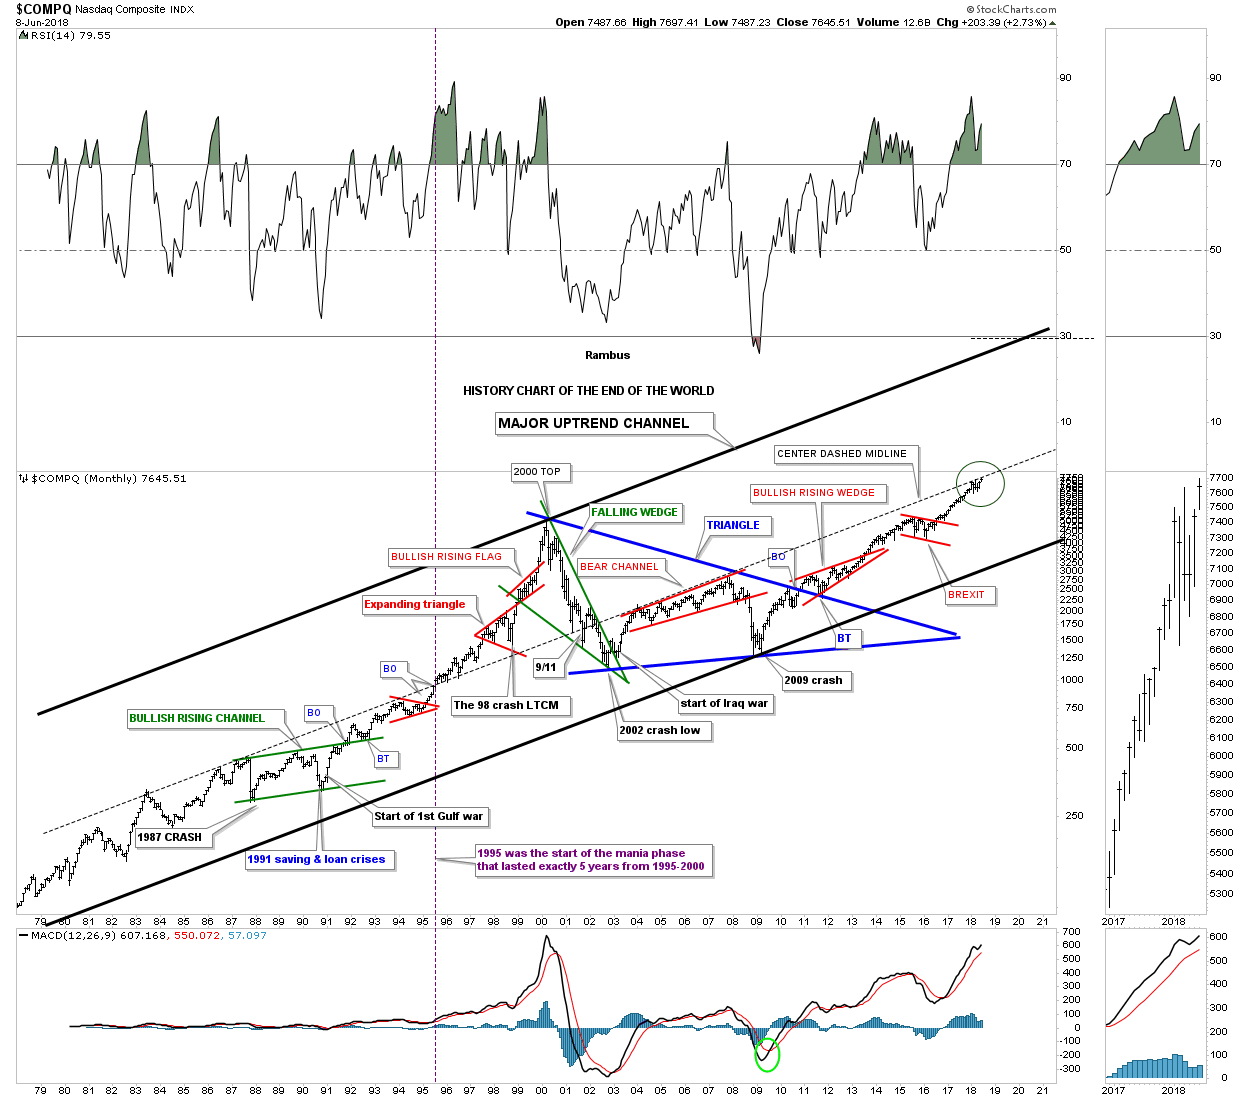
I have only one chart to show you tonight which I call the “History Chart of the End of the World,” which I built out in 2013. I usually show this chart a couple of times a year just to keep the big picture in perspective. This long term monthly chart shows all the earth shattering events that felt like the end of the world when they occurred and I can personally attest to that fact because I was in the markets in each one of those events.
The crash into the 2009 low was the last time we had anything that really felt like it would be a life changing event similar to the 1929 crash. As you can see, that end of the world event in 2009, formed the fourth reversal point in that 10 year blue triangle consolidation pattern. The last slightly little thing to put a scare into investors was the BREXIT vote in early 2016 that turned out to be a non event. Most have already forgotten about it, but for several weeks it was big news.
What I want to show you tonight is what has been happening in the last six months or so. First let me explain how I got the long term uptrend channel. If you notice the top and bottom rails only have one hit on them so how could they form the top and bottom rails? When I originally built this chart I used the center dashed midline because of all the touches it had mostly form below. The center dashed midline was initially broken to the upside in 1995 and was backtested several times before starting the parabolic rise into the 2000 bull market top that finally ended the bubble phase of that secular bull market.
That center dashed midline was tested from above during the LTCM, Long Term Capital Management crash, which some of you may recall. Then during the bear market that began at the 2000 high, green falling wedge, the COMPQ initially found support on the center dashed midline that produce a several month rally. Even after the 9/11 end of that world event, we saw a small rally off the center dashed midline. The 2000 bear market ended one year later in September of 2002. Note how the center dashed midline then held resistance from September of 2003 until October of 2007, red bear channel, which ended up being the bull market top which led to the 2009 crash low.
So from a Chartology perspective that center dashed midline carries a lot of weight because of all the touches it has. As you know the stock markets have been correcting since January of this year, about six months or so. The reason I’m showing you this chart tonight is because of the price action over the last six months as shown by the green circle. I’ve explained to you many times how an important trendline can be broken, first with the initial hit and small selloff and then a rally that breaks out above that important trendline and then one final backtest from above to finish off the breaking out and backtesting process.
Note the price action on the thumbnail on the right sidebar, especially the last six monthly bars. Now look at the price action inside the green circle. If I’m correct in the interpretation of the center dashed midline then the COMPQ is in the process of breaking out above that very important trendline. This month is still very young yet, but if we see the price action trading above the center dashed midline come the end of June then part two of the breaking out process will be completed. I would expect the breakout rally to be fairly shallow similar to the initial breakout in 1995 and then the backtesting process to begin from above.
The breakout in 1995 of the center dashed midline took five years to complete the bubble phase of that secular bull market. There is no way to know what the stock markets will do, but if the COMPQ breaks out above the center dashed midline this year in 2018 and it takes roughly five years to reach the top rail that would put the top around the 2023 area. Again there is no way to know, but if that were the case then this secular bull market that began in 2009 would be 14 years old in 2023 which is a bit on the short side as far as time is concerned. We could also expect to see at least one very hard shakeout that will feel like the end of the world, like the 1998 LTCM scare.
The bottom line is that there is no way to know what the future holds, but we have a game plan in place to help guide us in our investment journey into the future. As long as the game plan is woking we don’t need to fix it, but to allow it to show us the way until something significantly changes it. Have a great weekend. All the best…Rambus