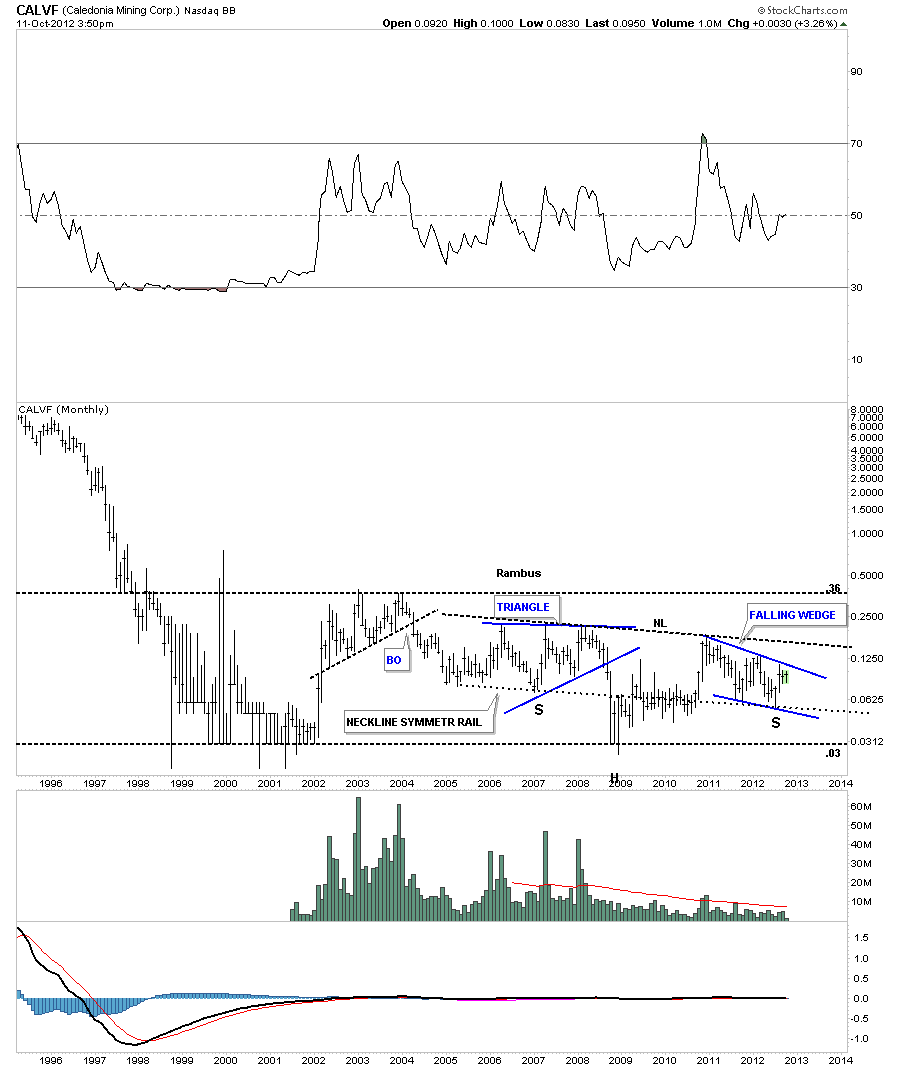
Fully asked me if I would post a chart on CALVF as there seems to be a big debate going on about this this stock. The monthly chart is the only chart that needs to be shown to get a feel of where its been in the past and where it’s currently trading. CALVF has been trading in a very large trading range between .03 at the low end and .36 at the top. There appears to be a possible large inverse H&S bottom forming with the left shoulder being a triangle and the right shoulder taking on the shape of a falling wedge. I’ve also put on a neckline symmetry rail, thin black dashed trendline, that is parallel to the neckline that showed the low for the right shoulder. The first step in the right direction would be for a close above the top rail of the falling wedge on increased volume. There could be a ping pong move between the neckline and the top blue rail of the falling wedge which would be a backtest move. The real tell will be a breakout of the potential neckline of the inverse H&S bottom on big volume. So far volume is light on the falling wedge, right shoulder, which is OK for now. It just needs to start expanding when and if a breakout occurs. All the best…Rambus
Rambus Chartology
Moving forward

