Many investors are giving up on the US dollar as it has been consolidating for some time now. There is a pattern on the shorter term daily chart which is starting to come alive, but needs a little more work to complete.
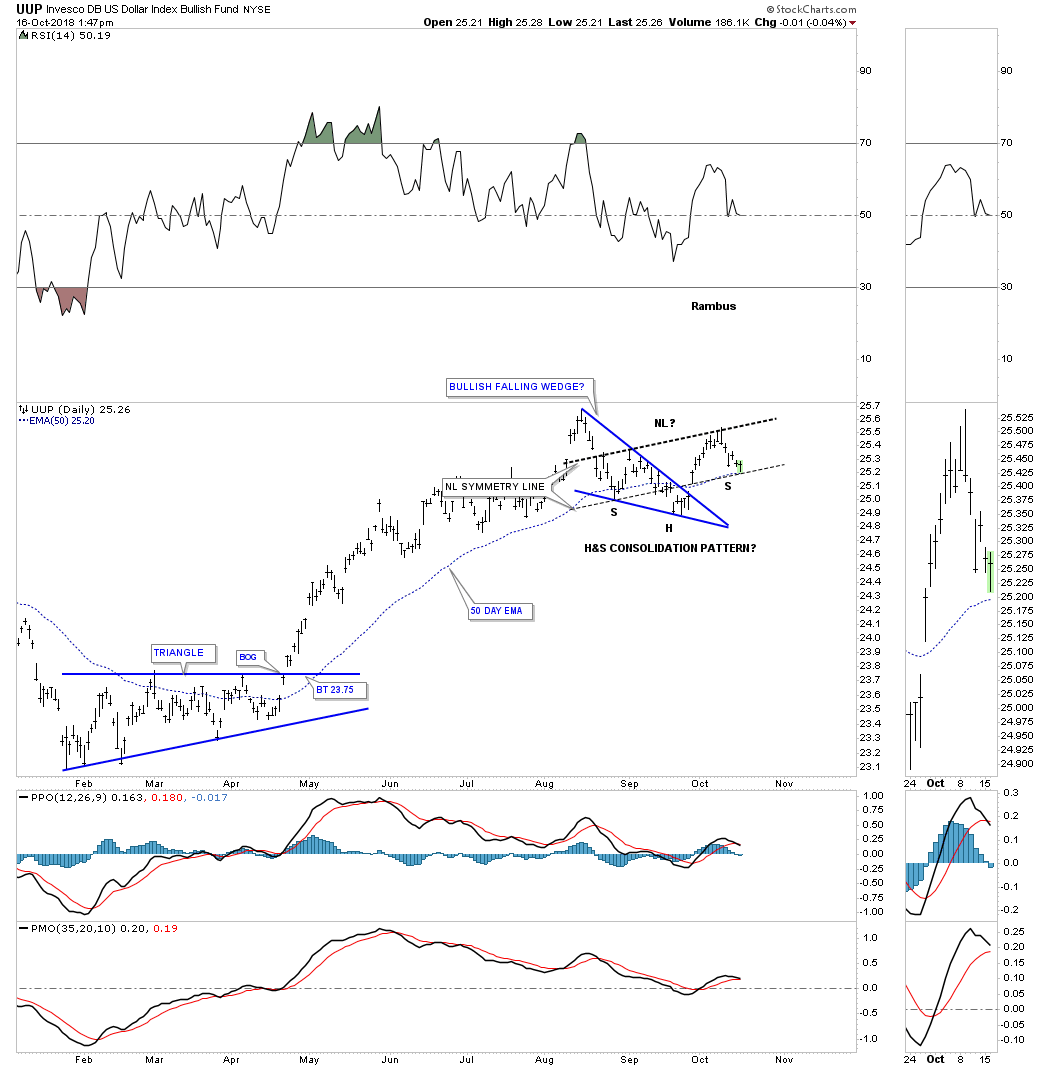
Below is a daily chart for the UUP which is still showing bull market chariteristics as it has been forming higher highs and higher lows which is creating an uptrend. I have shown you many cases of a classic H&S pattern when the price action forms the left shoulder and head inside of a wedge with the right shoulder low forming on the backtest or fairly close to the backtest to the top rail of the wedge pattern or neckline symmetry line.
In mid September we looked at this blue bullish falling wedge which could have been a stand alone pattern that could have started the next impulse leg higher for the UUP. As you can see the price action failed to take out the top of the blue falling wedge. That suggested to me a bigger consolidation pattern is most likely to form. It will still be a consolidation pattern but a slightly bigger consolidation pattern. Just like the daily PM combo chart we looked at this morning with the uncompleted expanding rising wedge building out the UUP also has an uncompleted H&S consolidation pattern under construction.
Note how the left shoulder and head formed inside the blue bullish falling wedge with the right shoulder low testing the neckline symmetry line today. Again, keep in mind this H&S consolidation pattern won’t be complete until the neckline is broken to the upside. If the low this morning holds support on the neckline symmetry line the last order of business is for the UUP to rally above the neckline to complete this high level consolidation pattern.
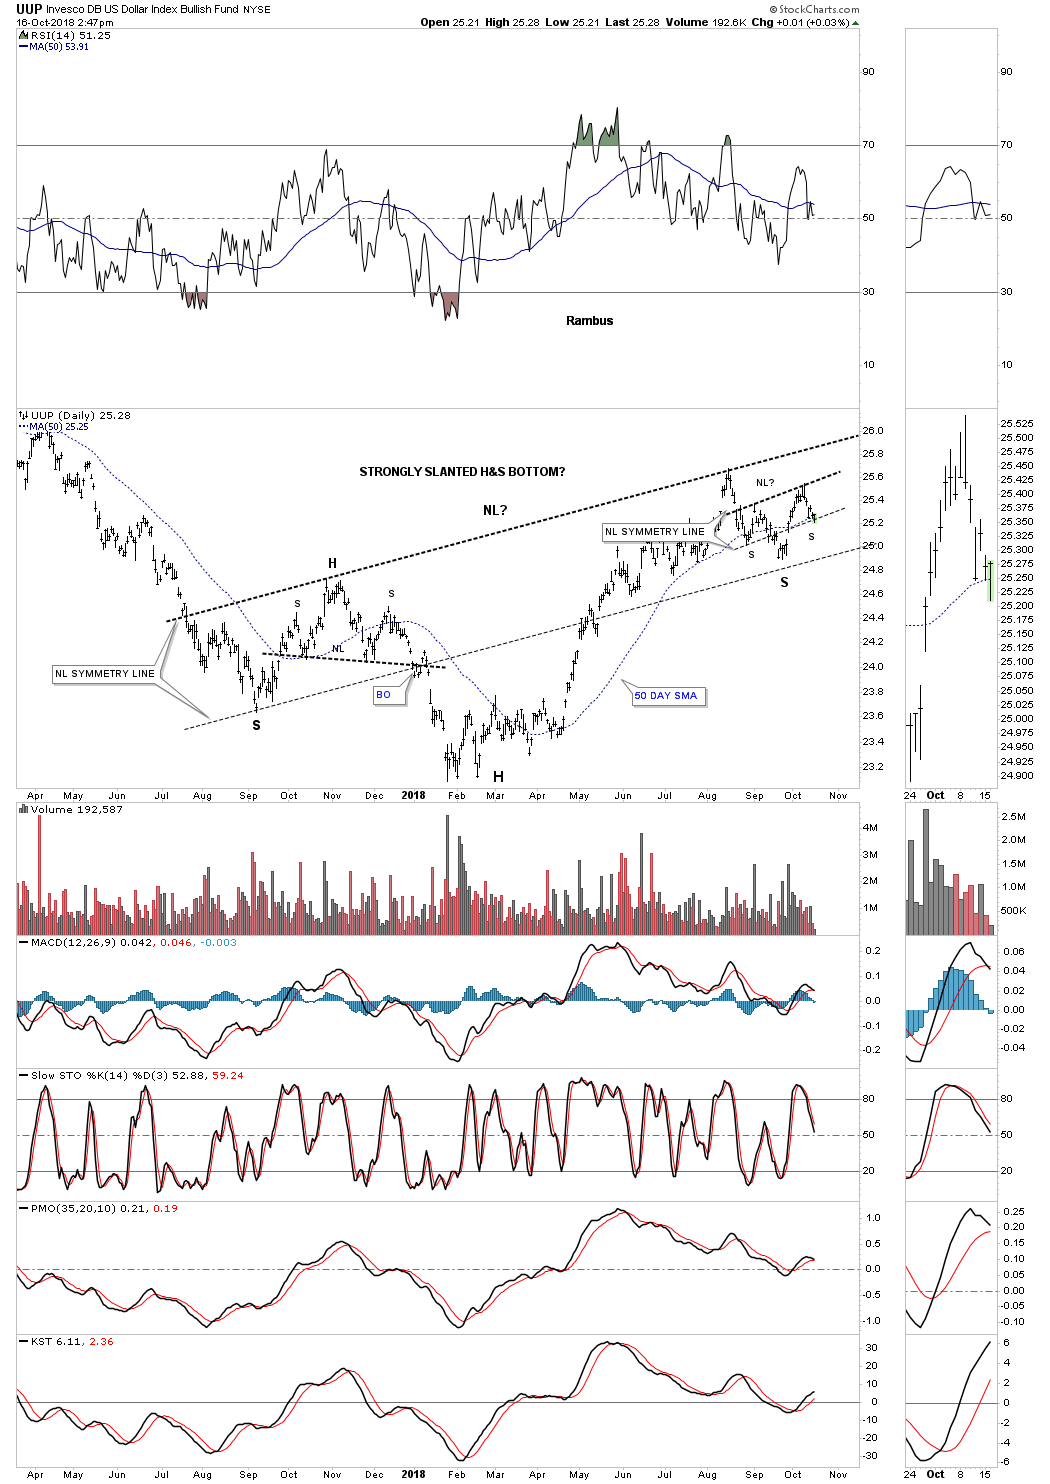
Below is a longer term daily chart which shows an even bigger H&S bottom building out. There is some really nice symmetry taking place on this chart starting with the neckline symmetry line which shows the low for the right shoulder. The small H&S consolidation pattern we just looked at on the daily chart above is also showing a neckline symmetry line which is showing the bottom for the right shoulder as well. On the left side of the H&S the UUP built out a H&S top which led to the February bottom this year. Now we have a H&S consolidation pattern forming on the right side of the head that somewhat matches the H&S top on the left side of the chart but inverted. As you can see the UUP is trading at a critical area on the chart. The implacations for many different areas of the markets will most likely be profound if this 15 month H&S bottom completes.
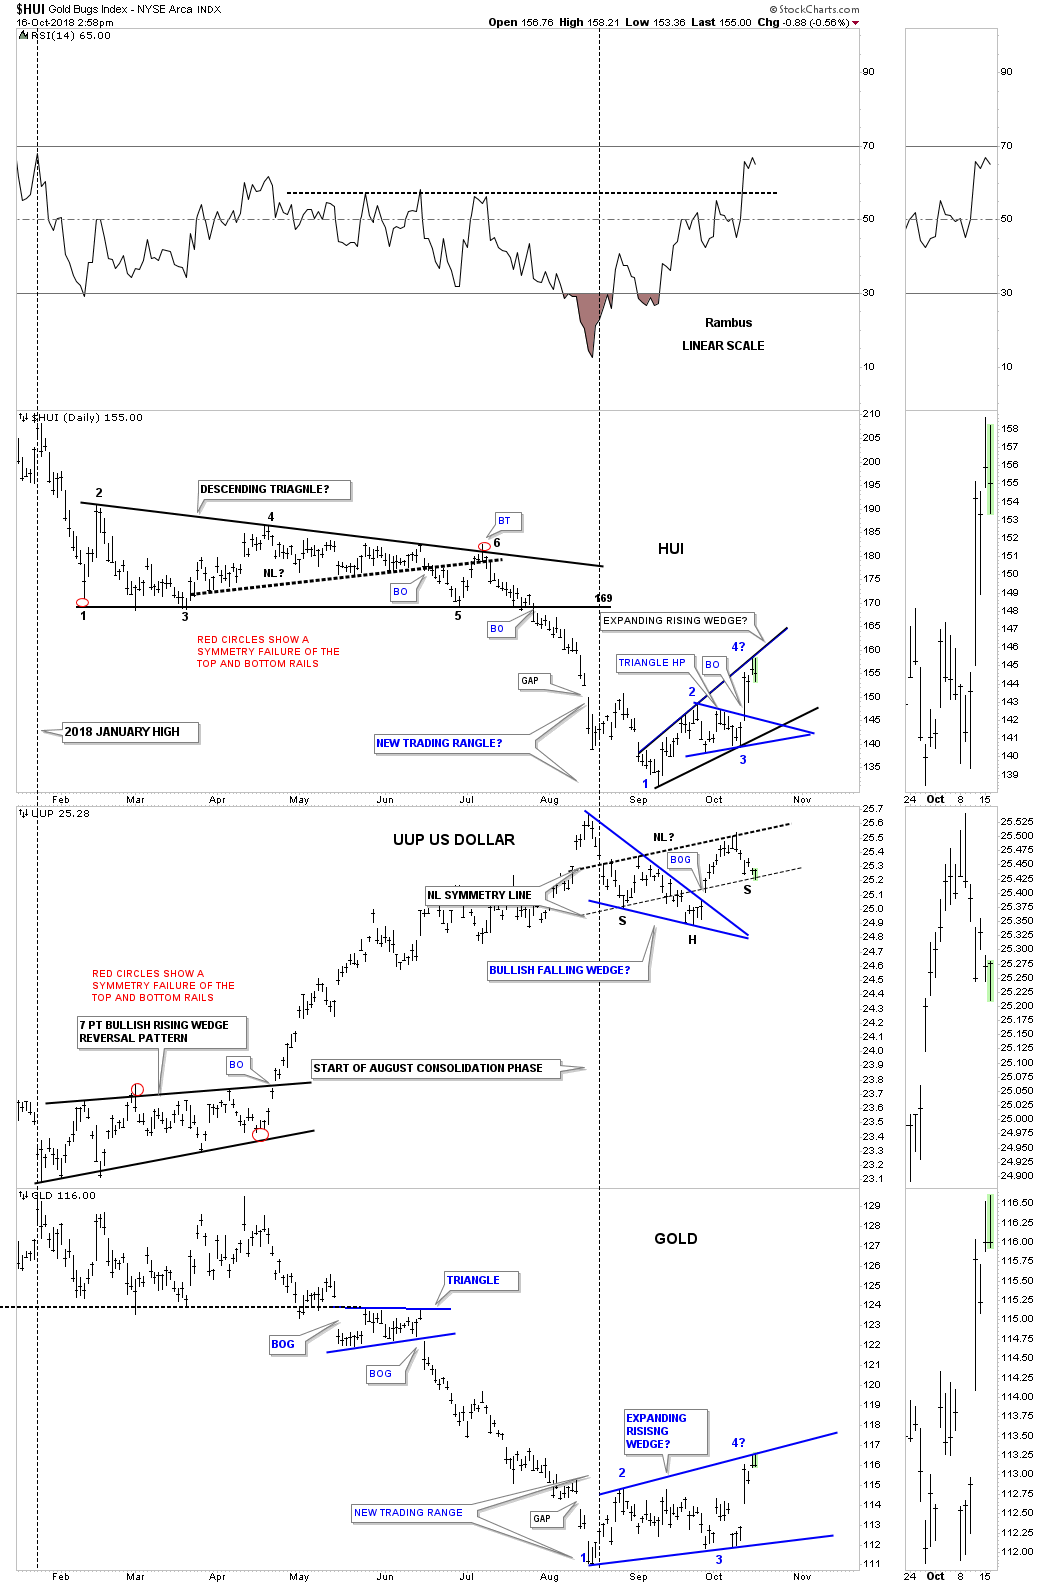
Below is the HUI, UUP and GLD combo chart we’ve been following which has done a little morphing, but the main theme of this area being a place for some type of consolidation pattern to build out is still in place. Each has been testing an important trendline over the last two days. Will they hold is the $64,000 question?