When I sold all my precious metals stocks and went to cash back on April 1st and 2nd I mentioned there were two things I was seeing that I didn’t like. The first thing I mentioned was that there were some failing triangles and rising wedges on the shorter term daily charts. The second thing I didn’t like was that many of the PM stocks were failing at the top rail of their 2016 falling wedges or flags. Those were warning signs for me. At this moment I’m neither bullish or bearish the PM complex but neutral. I see some PM stocks holding up rather well while others are declining and breaking important short term support, a mixed bag.
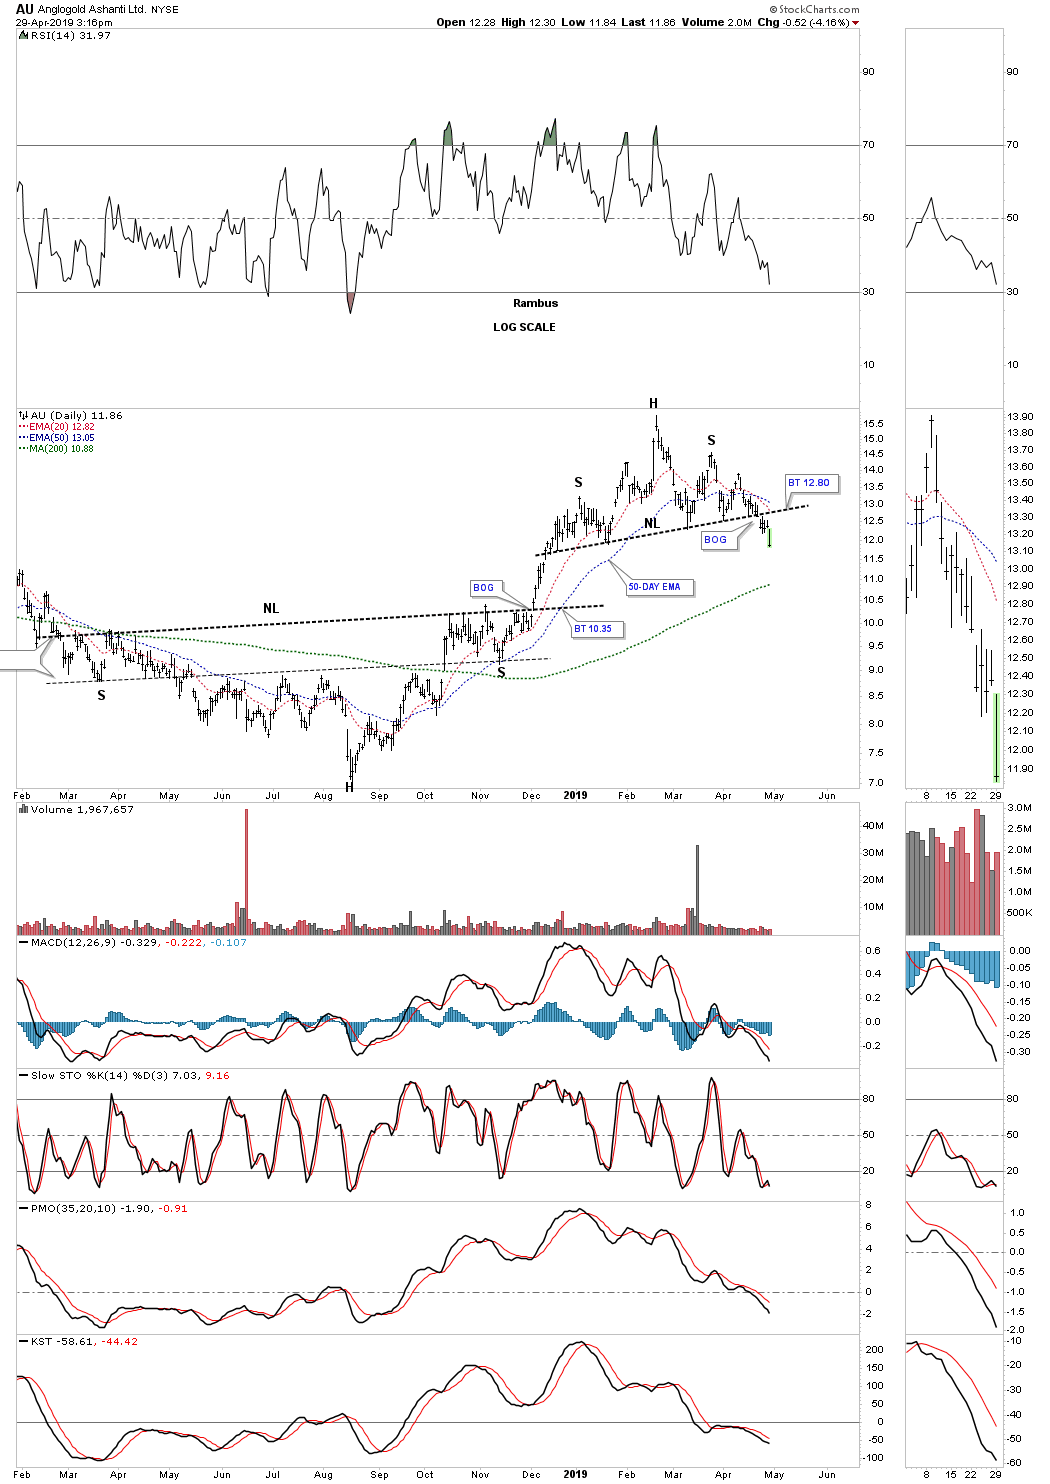
AU was one of the leaders but broke down below its neckline last week and completed a backtest.
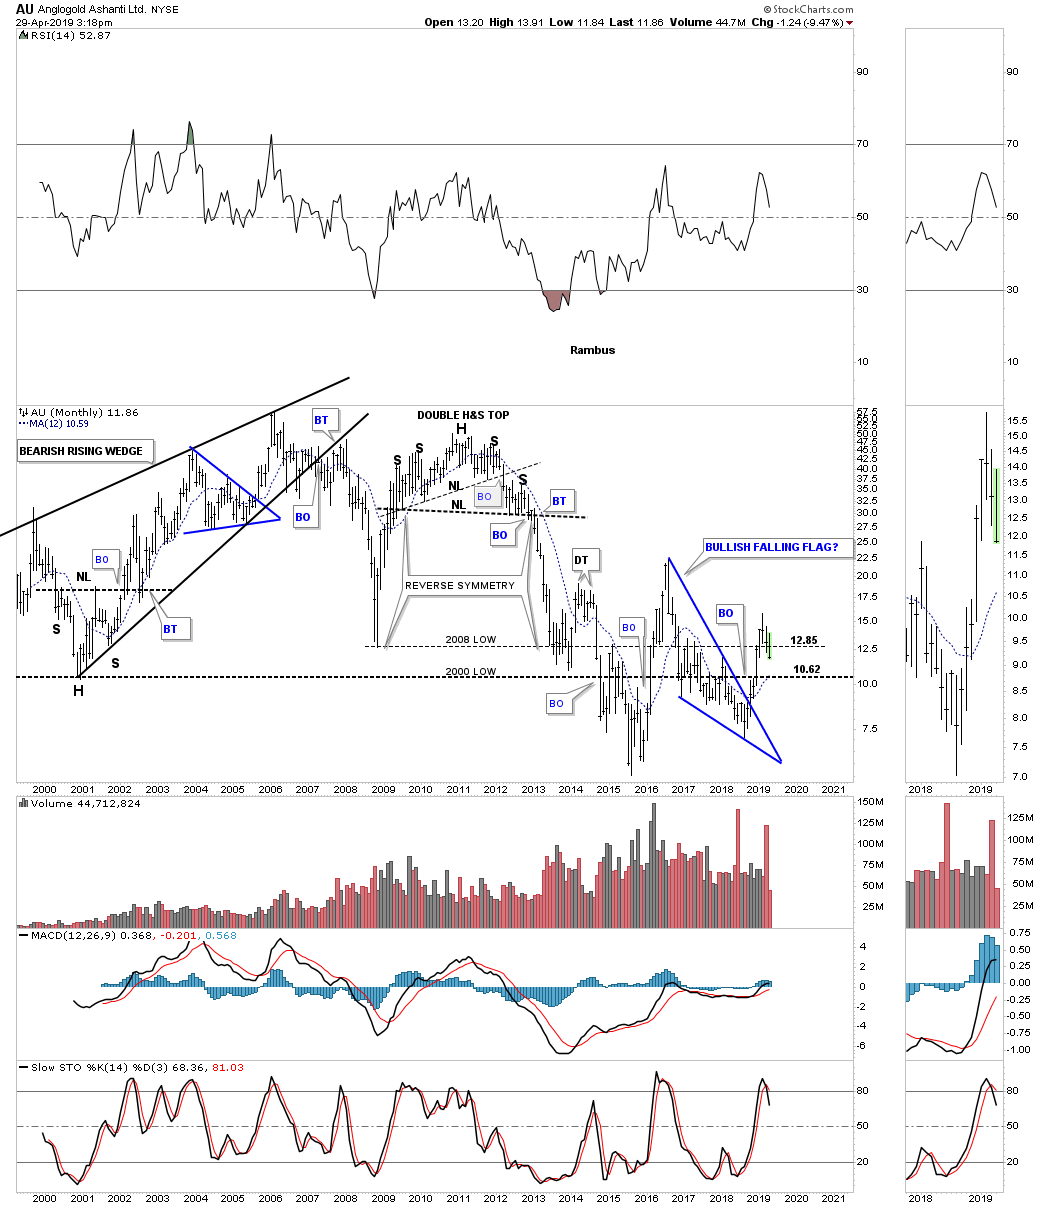
AU monthly looking for support possibly at the 12 month ma?
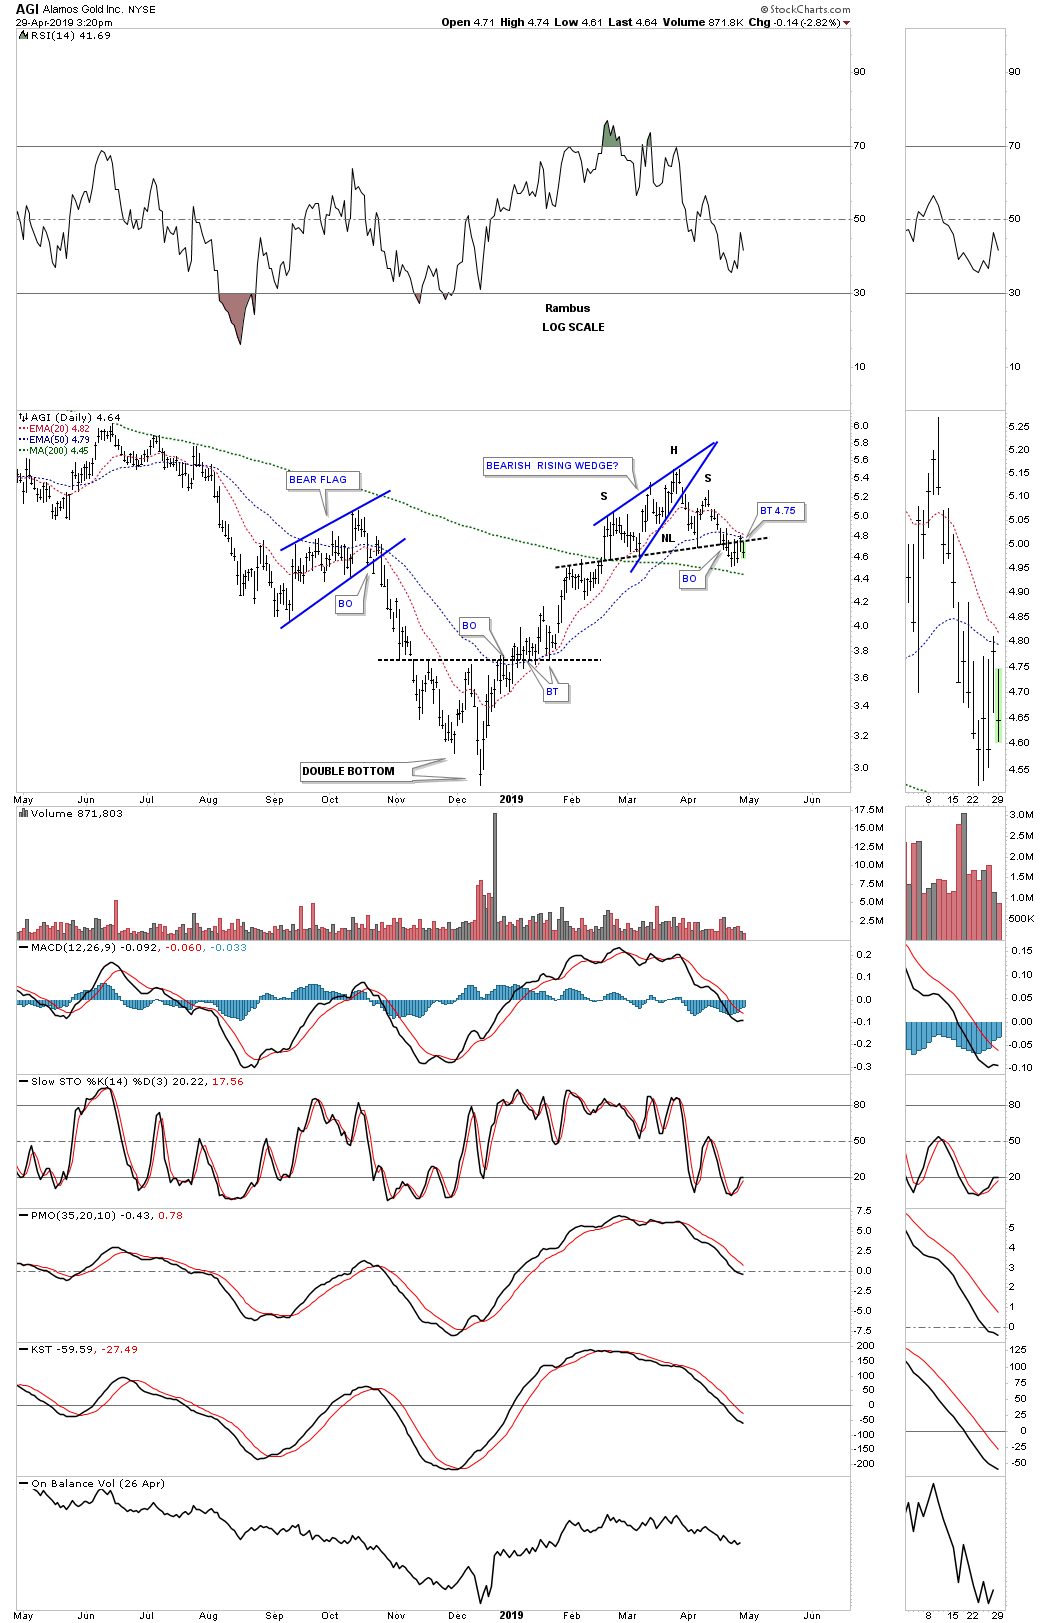
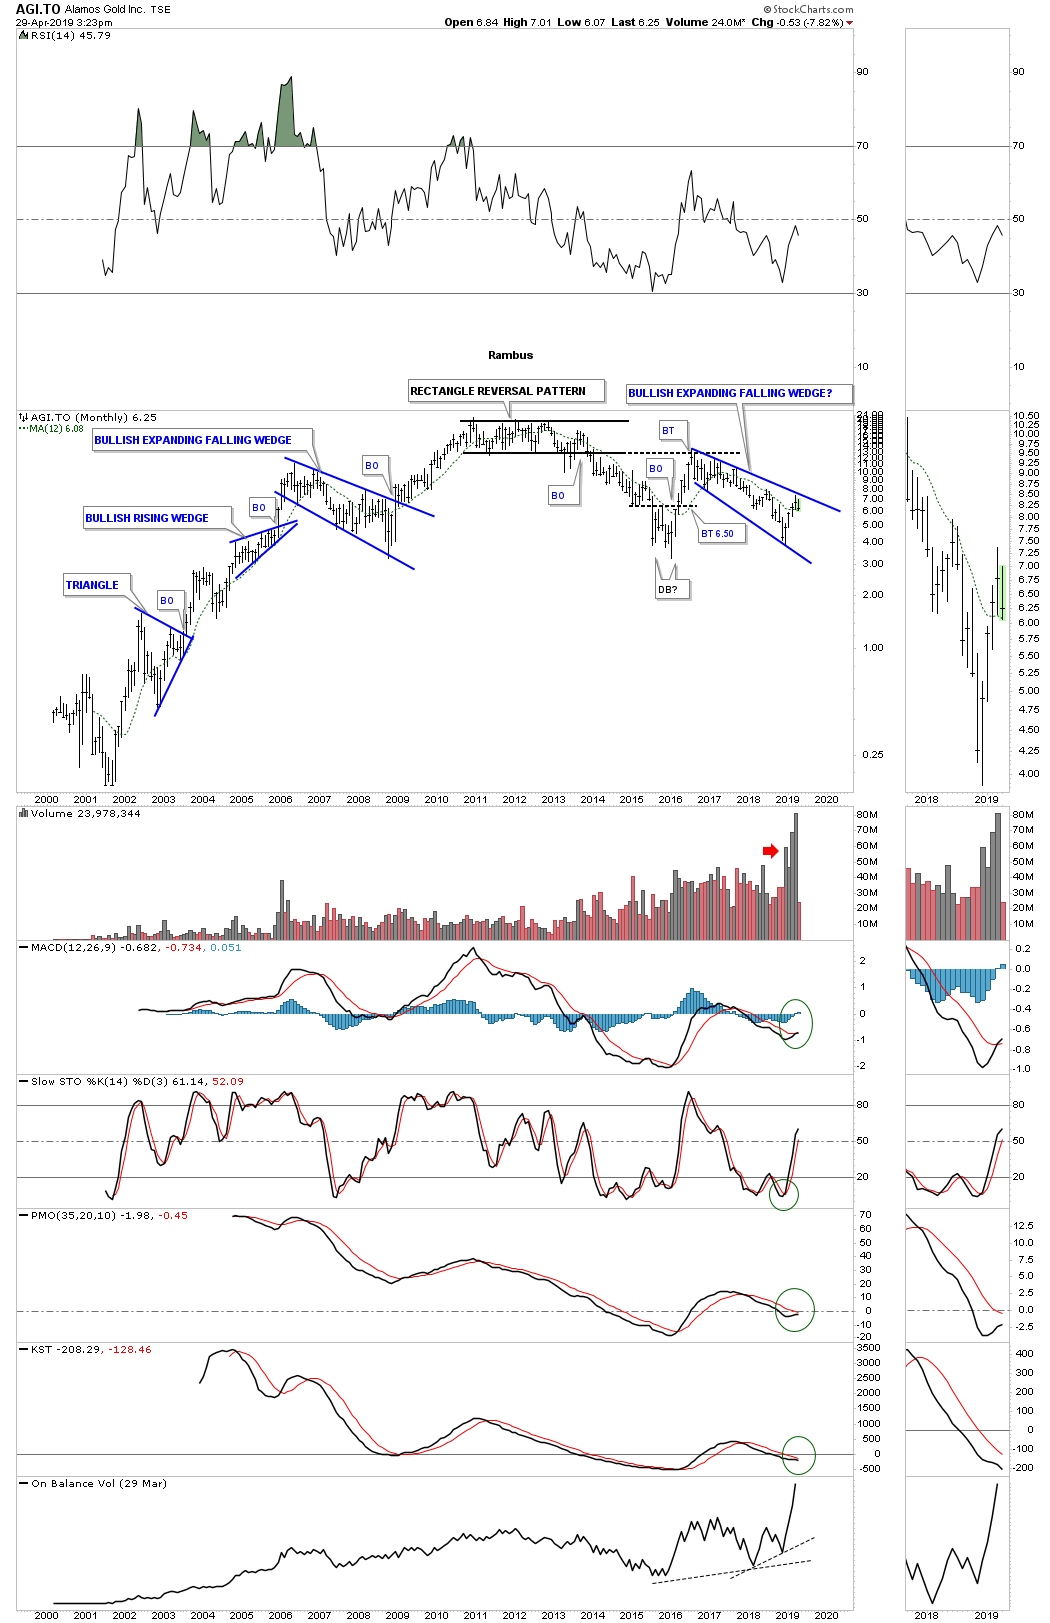
This daily chart for AGI.TO shows the rising wedge which I was expecting to breakout topside if the impulse move was strong but it failed to deliver and broken through the bottom rail completing a bearish rising wedge. The price action has now morphed into a H&S top with the neckline getting backtested today.
This monthly chart shows the 2016 expanding falling wedge is still in play but we need to see the top rail broken to the upside to really get excited.
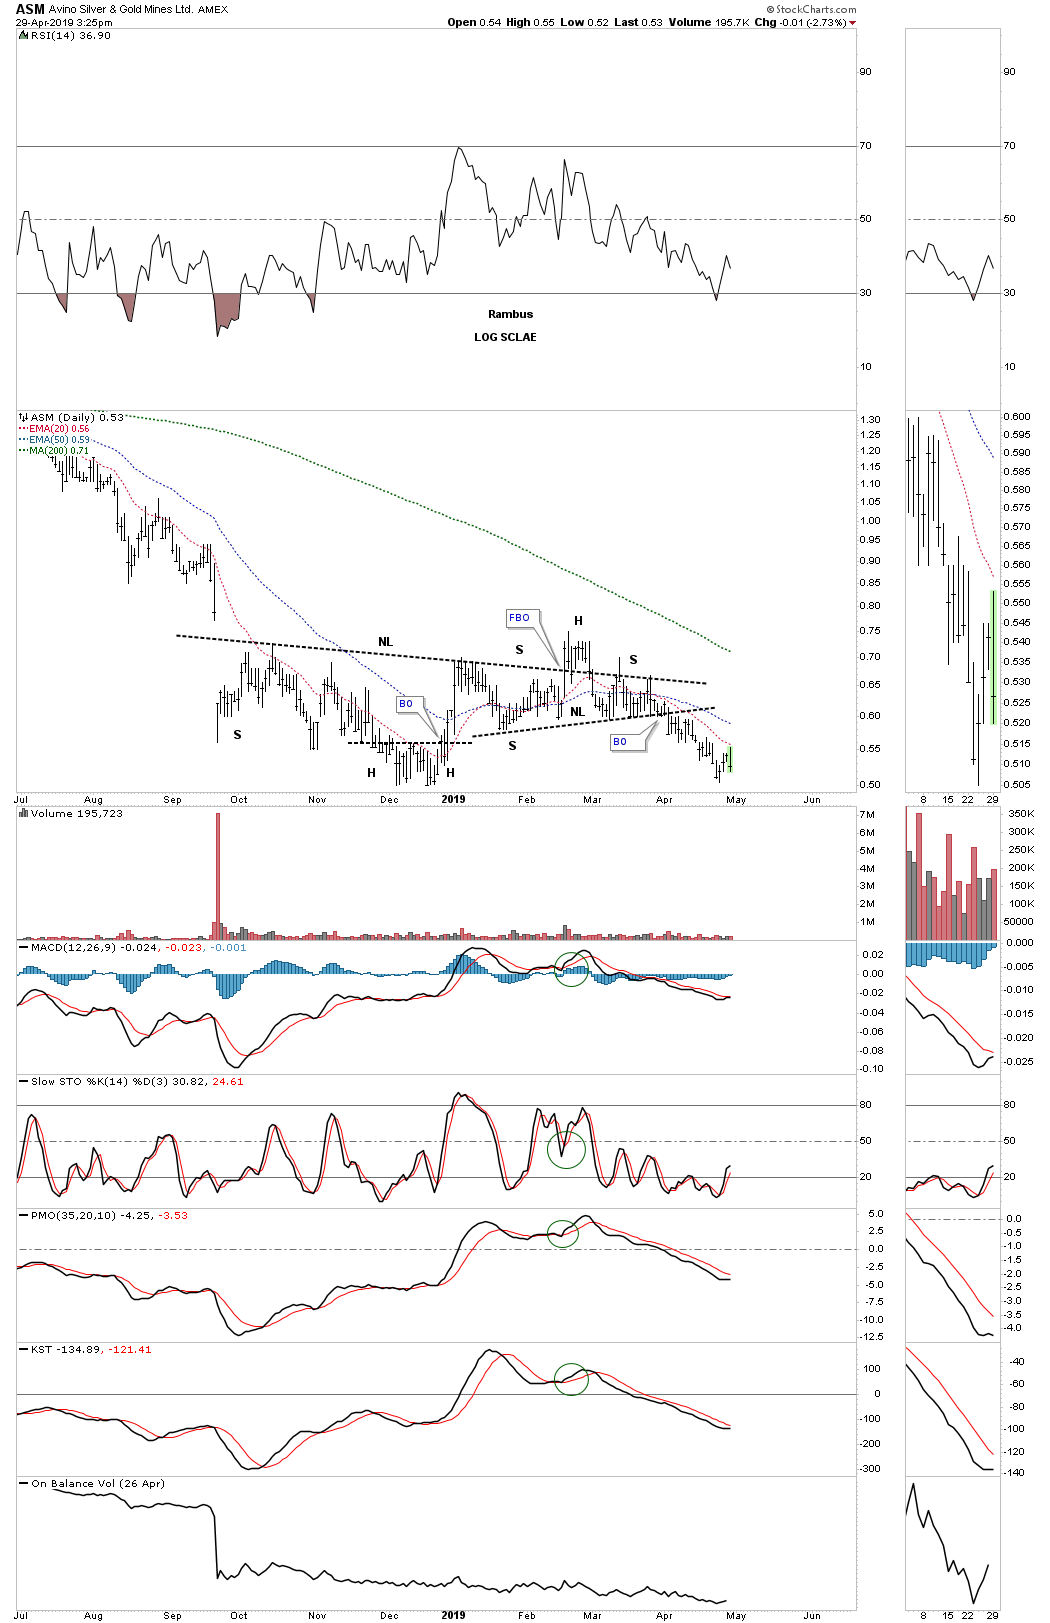
The last time I posted this chart I asked the question, would the real H&S pattern please standup?
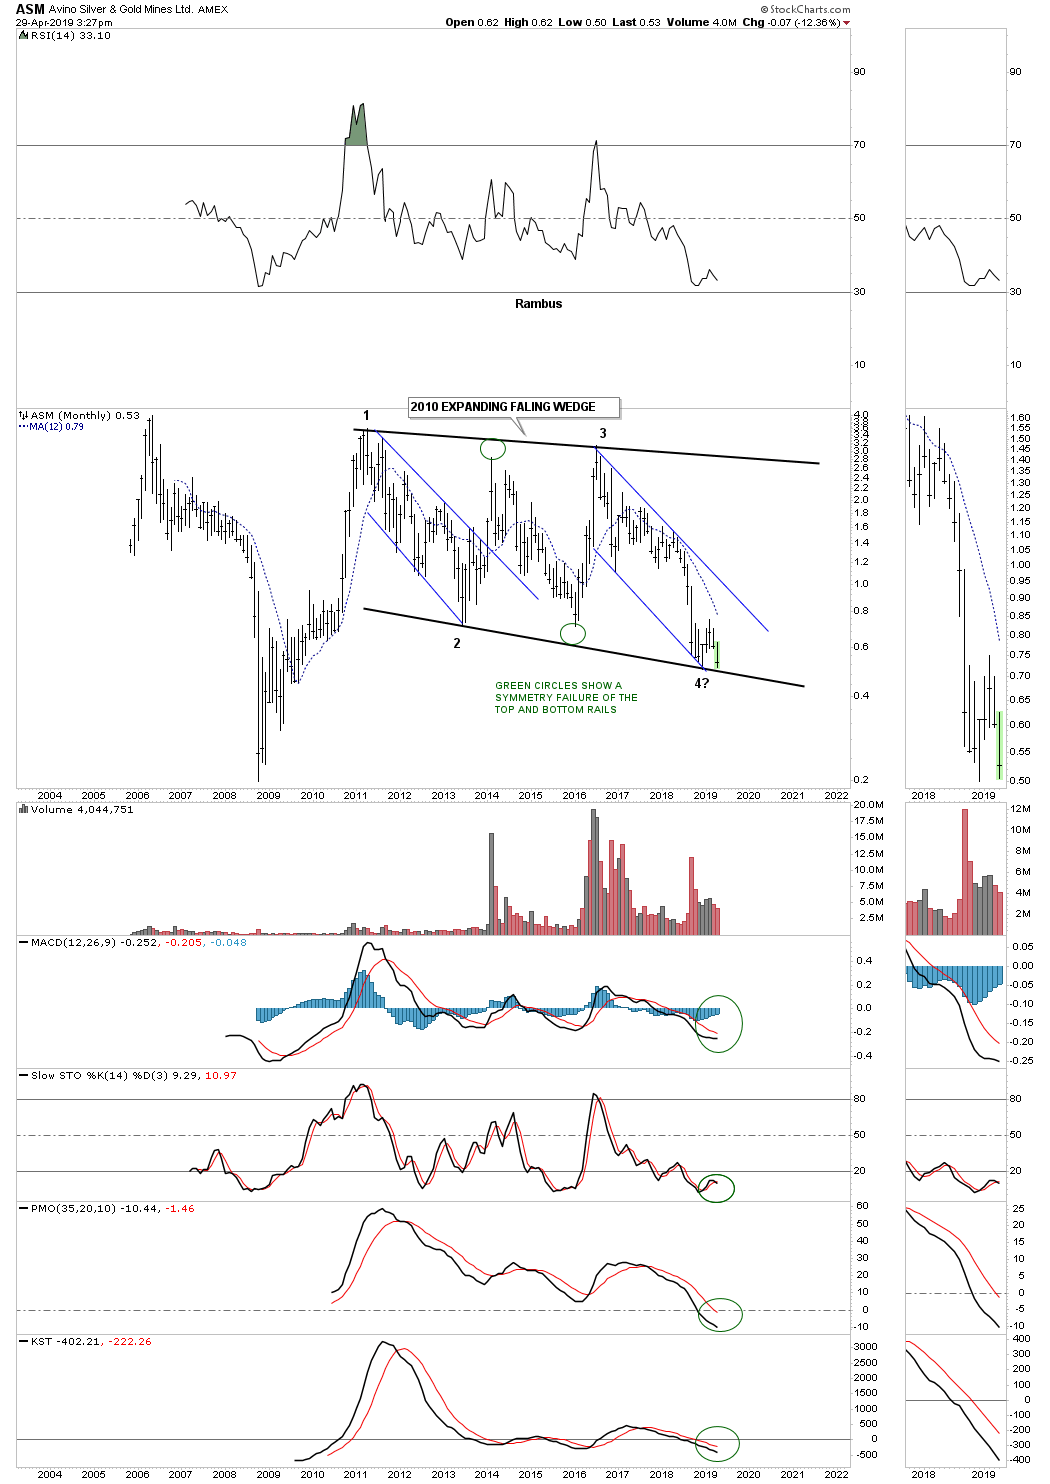
This monthly chart shows a very important price point that ASM is now trading at which is a low risk entry point if anyone is brave enough to take a chance.
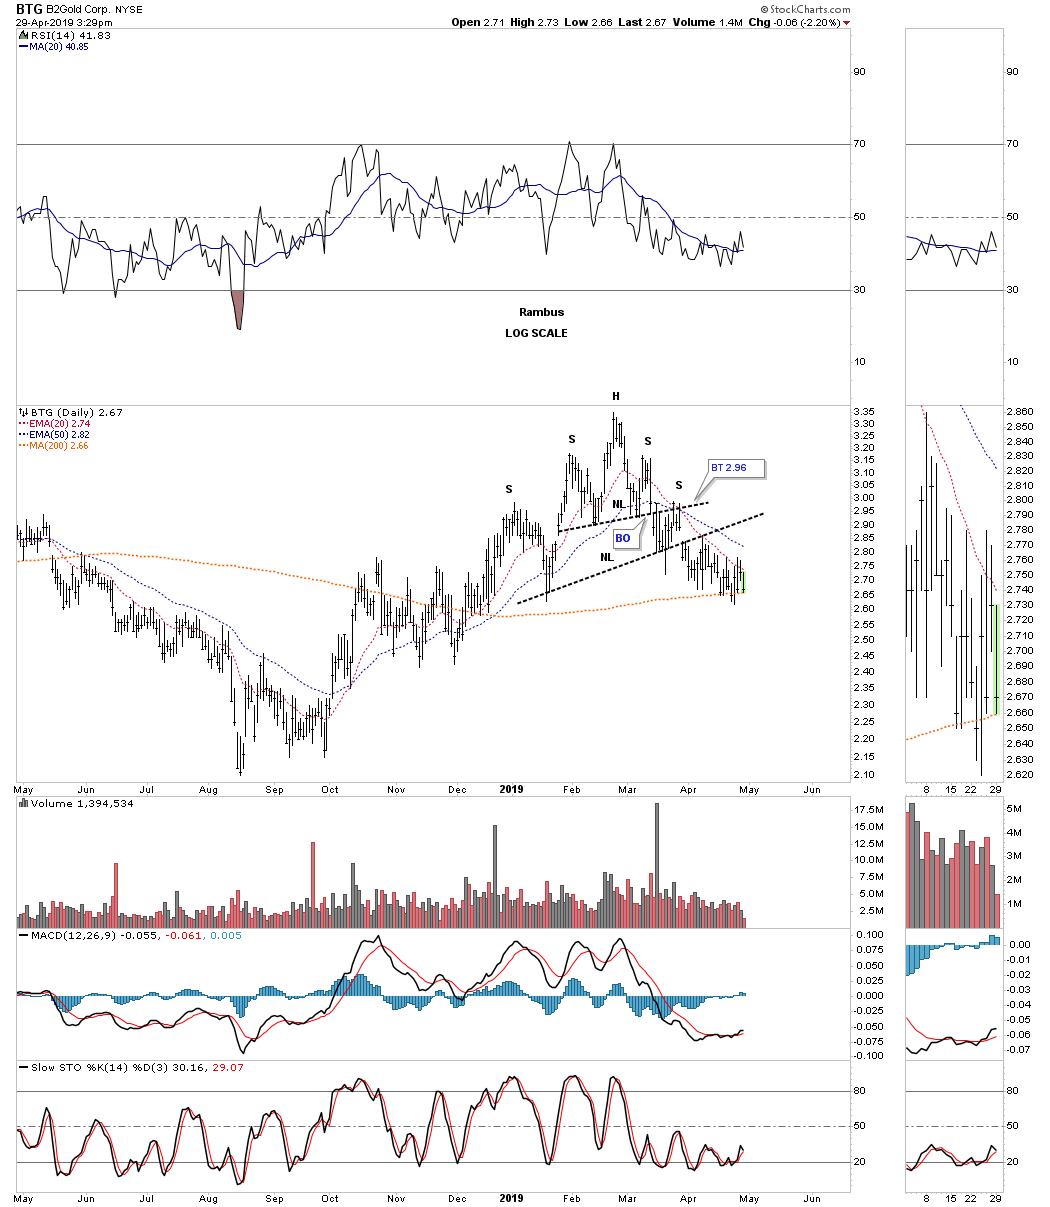
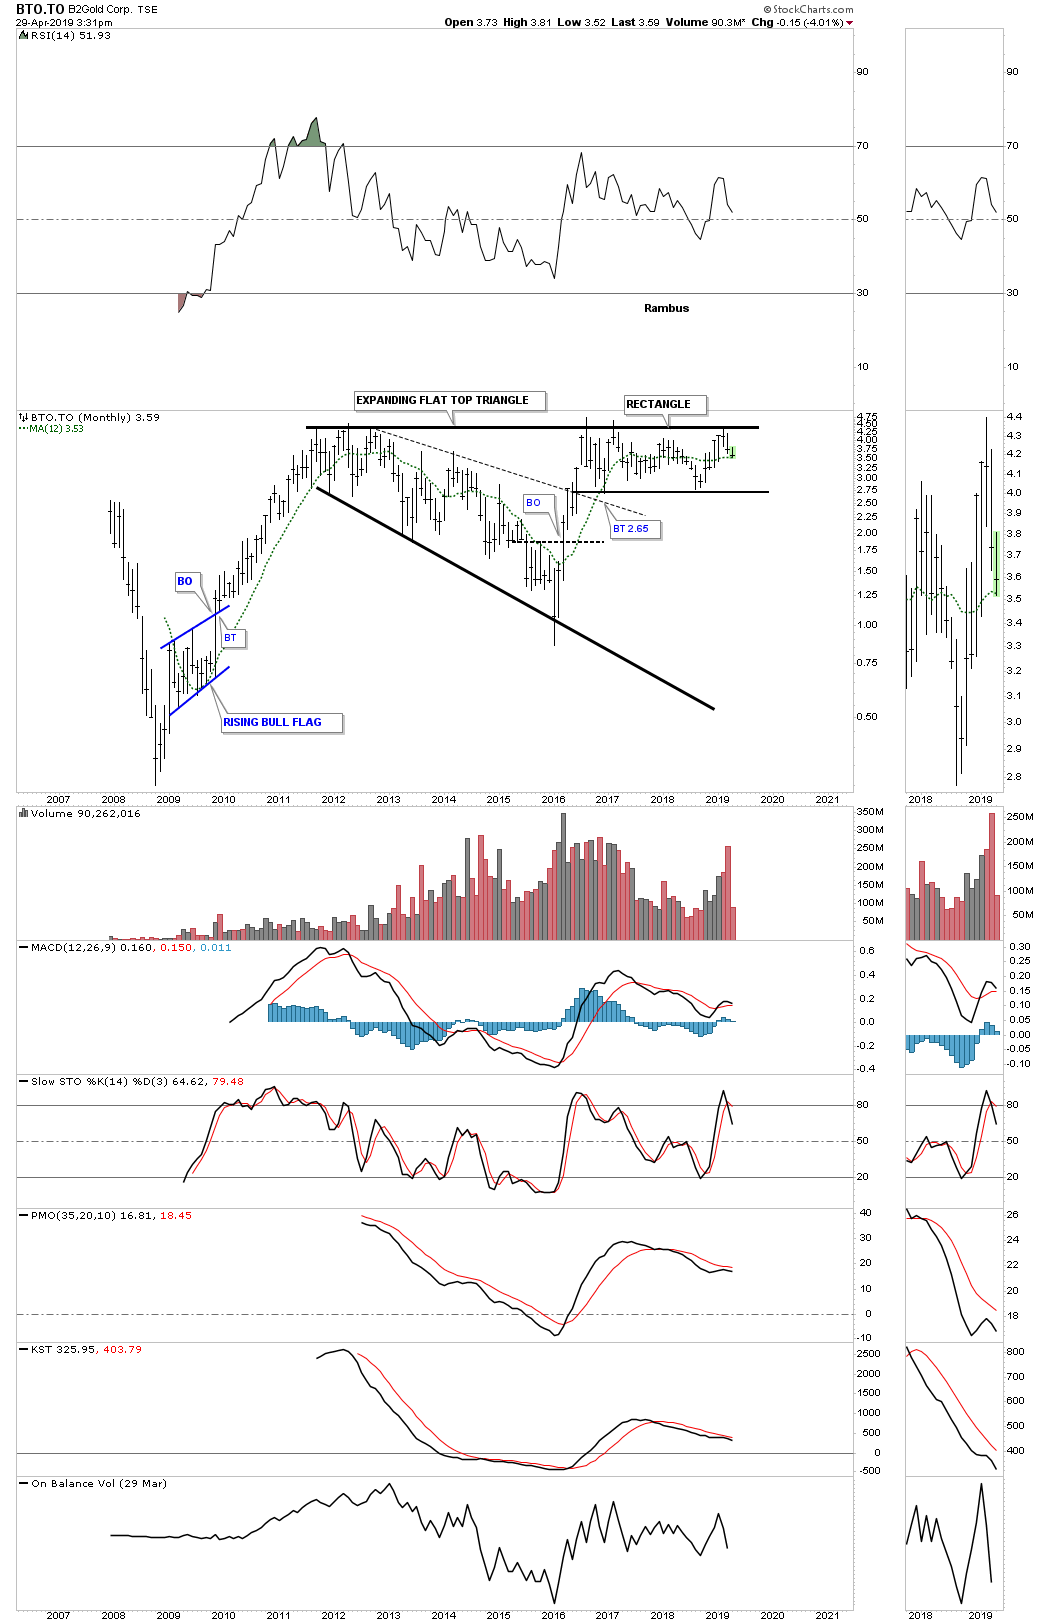
BTG H&S top.
The monthly chart for BTO.TO hit the top rail of its trading range but failed to breakout. This is one stock I’ll be interested in when the top rail gives way.
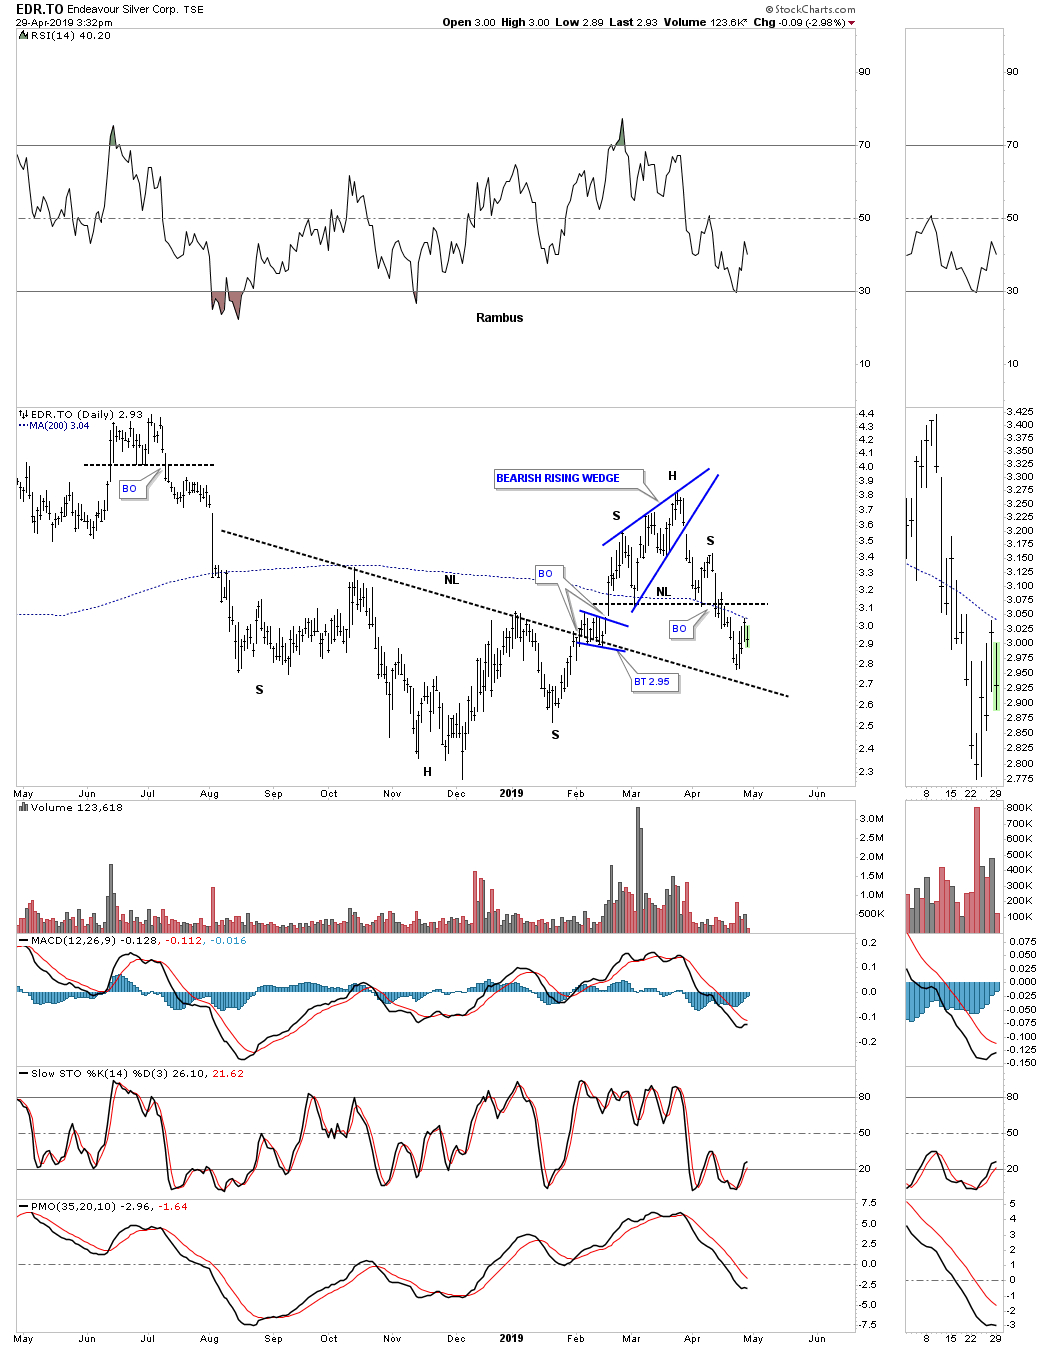
This daily chart for the EDR.TO built out a beautiful rising wedge and all it had to do was breakout above the top rail but it broke down instead which is not what I wanted to see. Now it has morphed into a small H&S top. Maybe the old neckline can offer some support.
FR.TO builtout a very nice triangle right on the neckline which should have been a bullish setup. There was a false breakout above the top rail but it ended up being bull trap. Now it’s trading below the neckline.
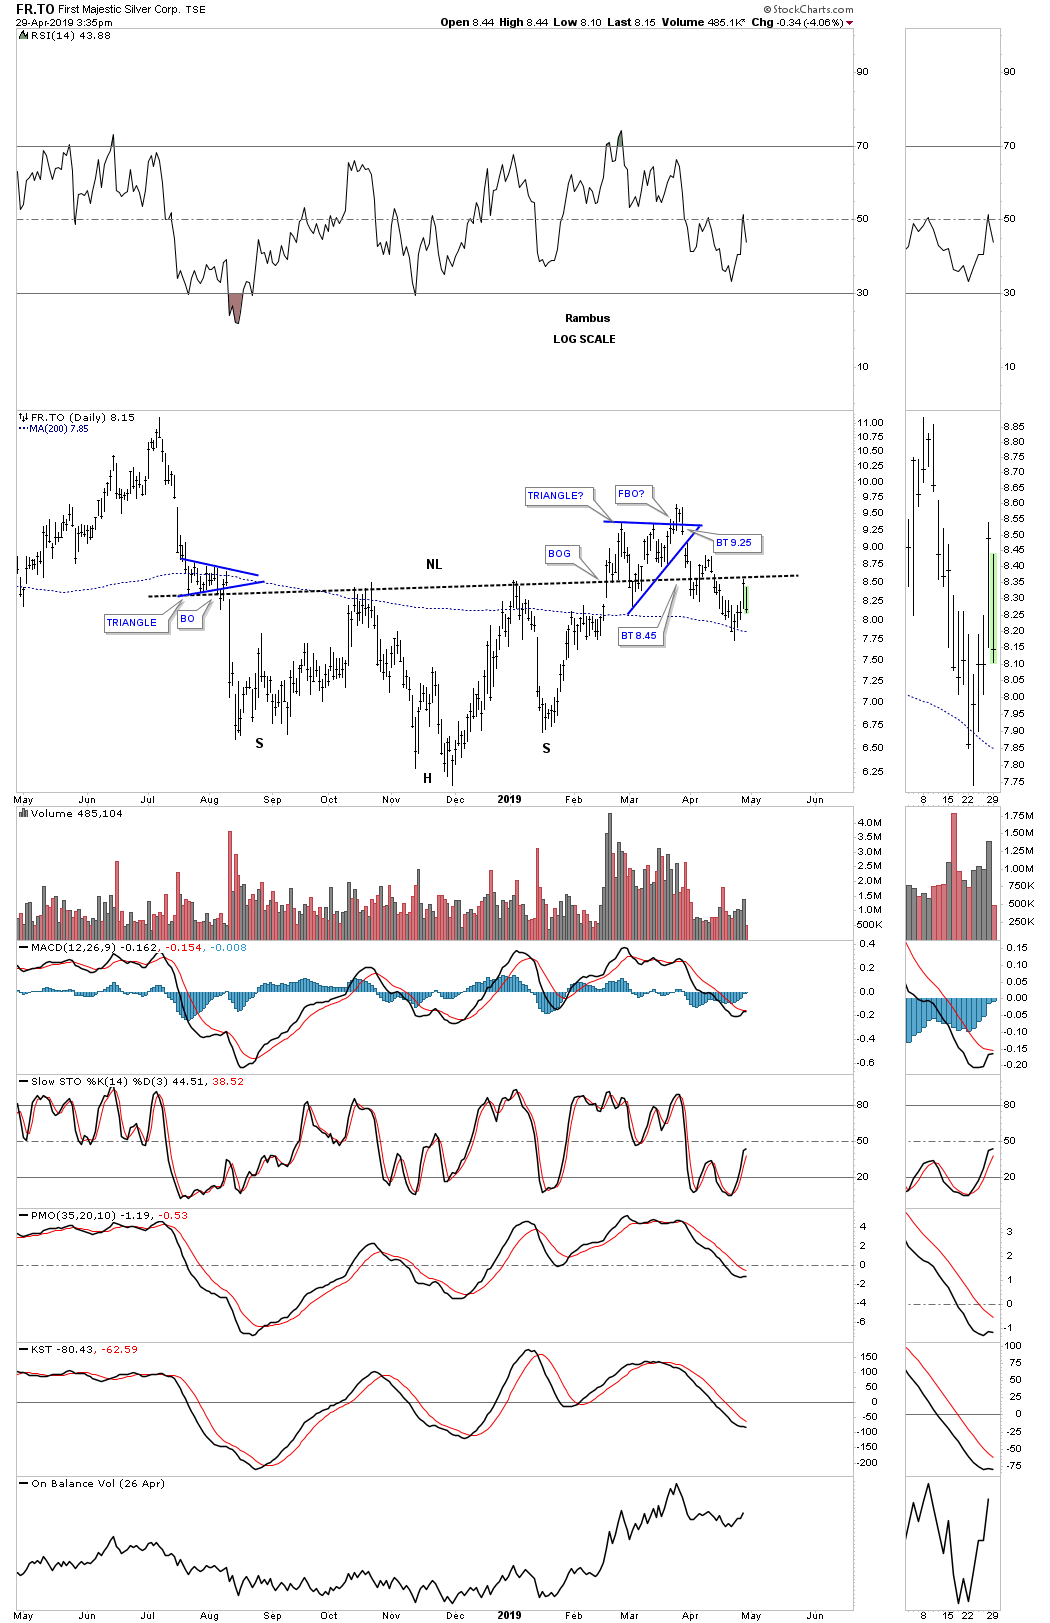
The top rail of its 2016 falling wedge is still holding support at this time but the failure of the neckline to hold support on the backtest is troubling.

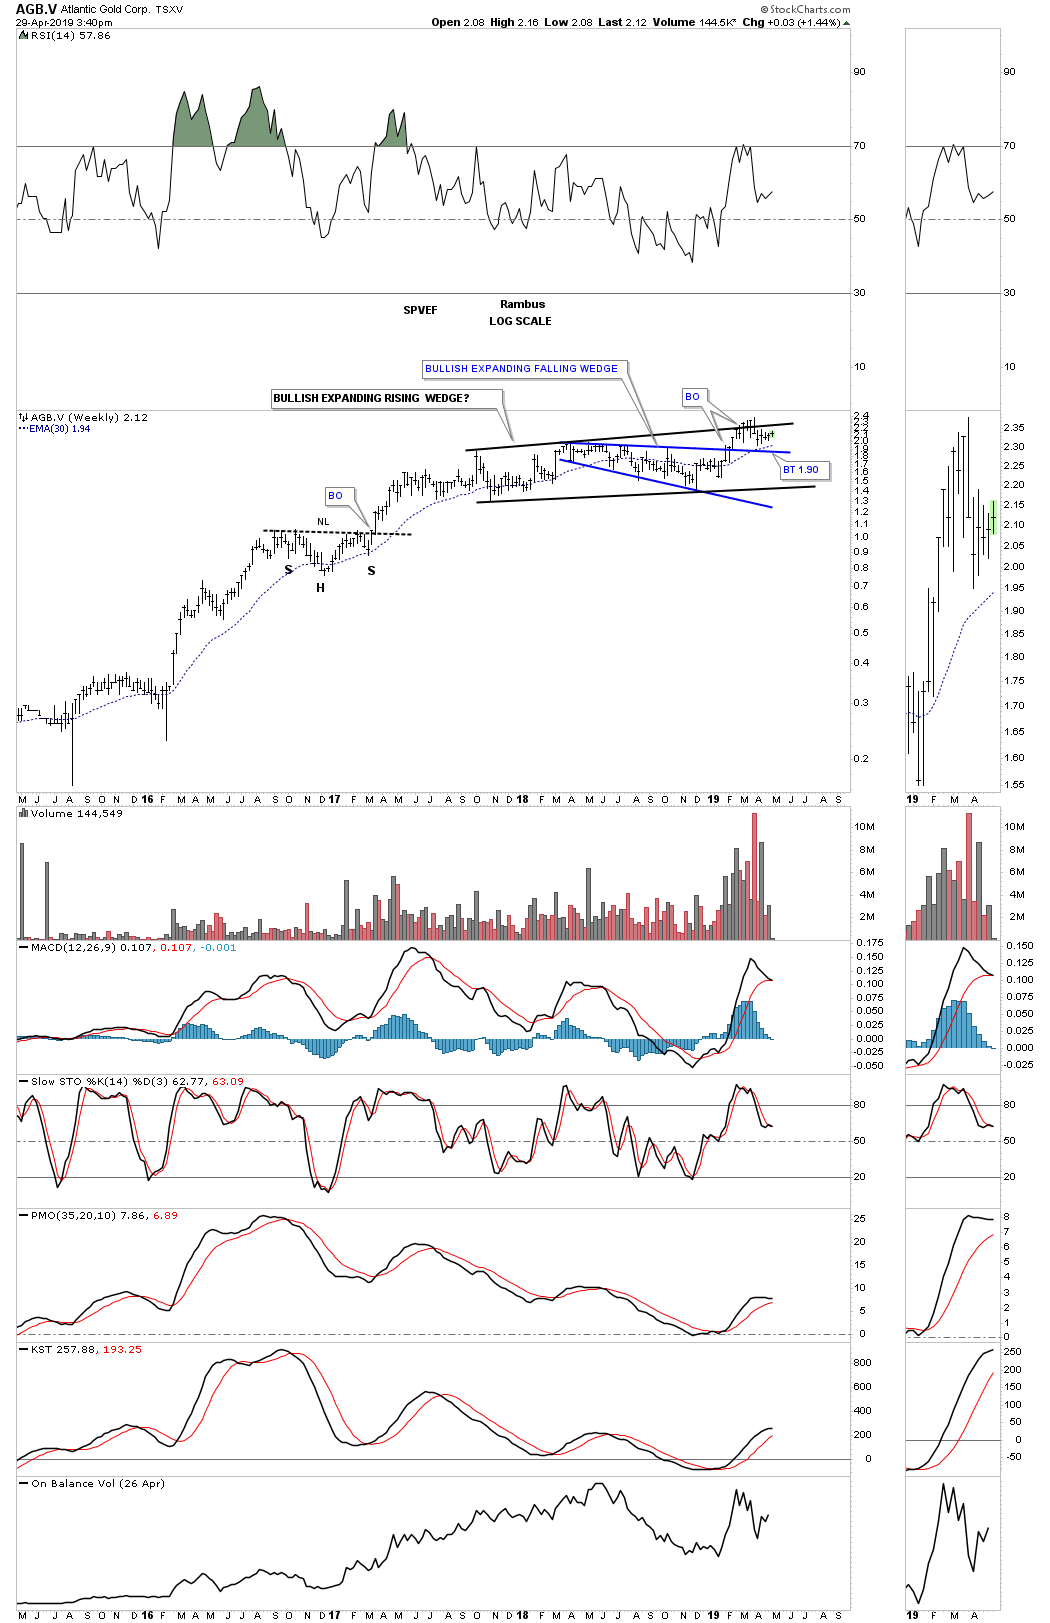
AGB.V is another one I’m keeping a close eye on if it can takeout the top rail of its black expanding rising wedge.
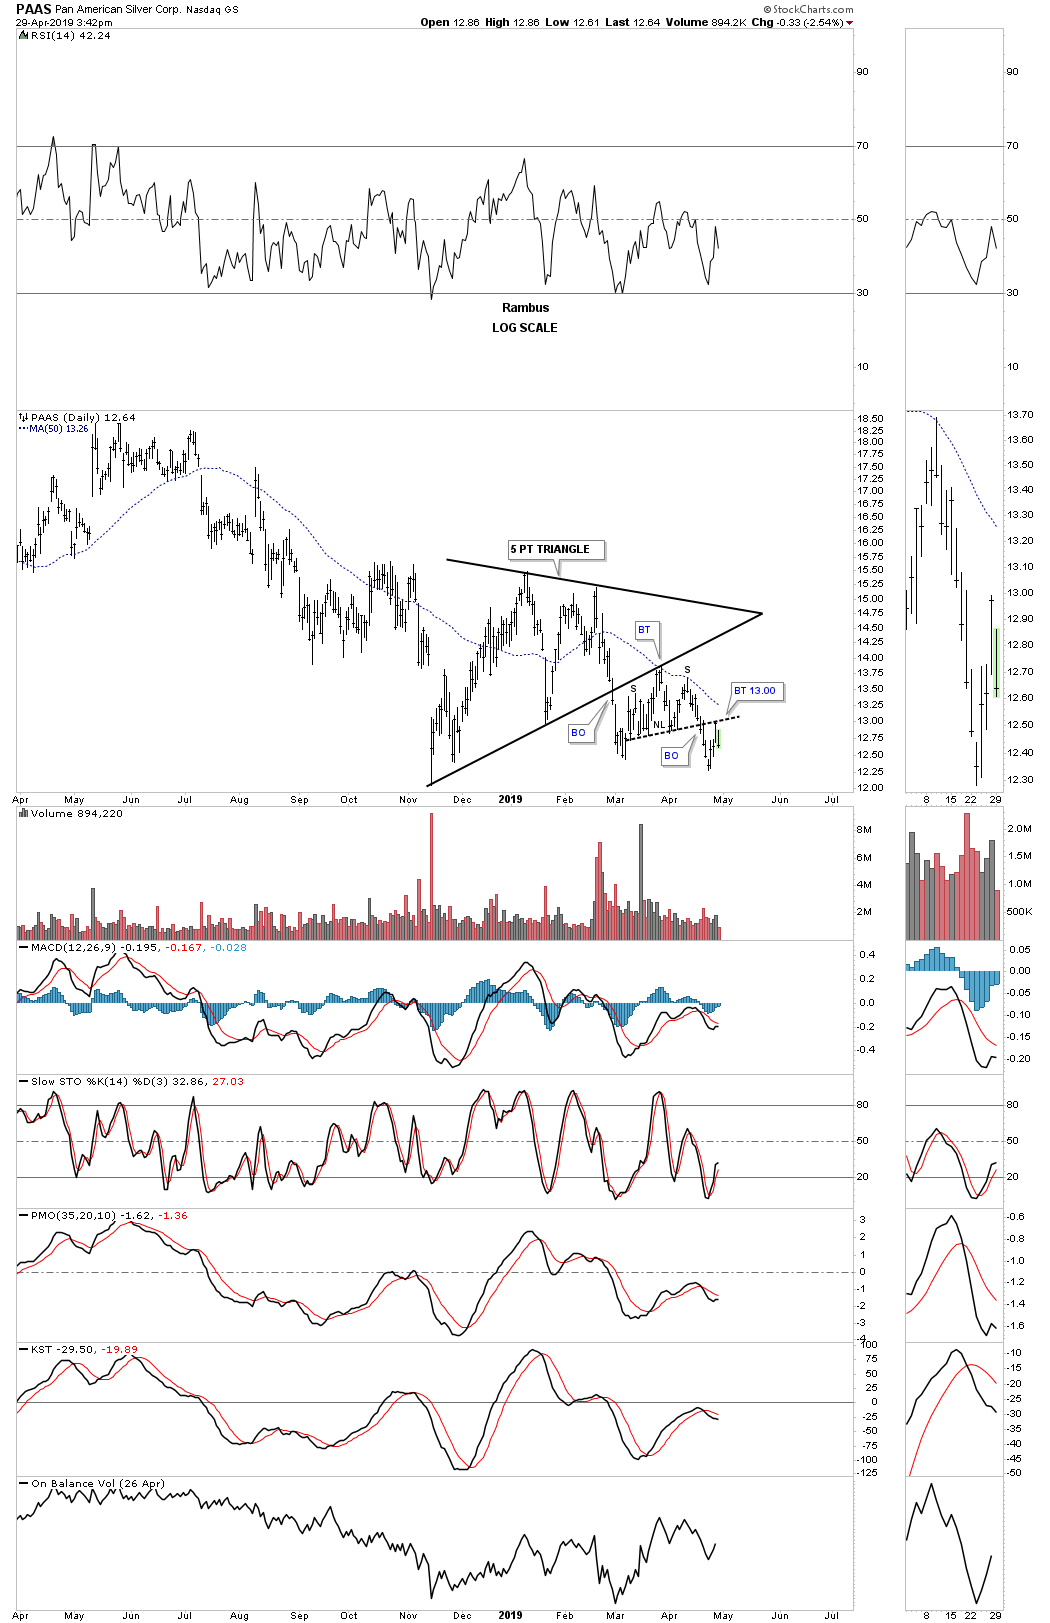
PAAS has one ugly daily chart. After breaking down from the 4 point triangle consolidation pattern the price action has formed a H&S top as the backtest to the bottom rail.
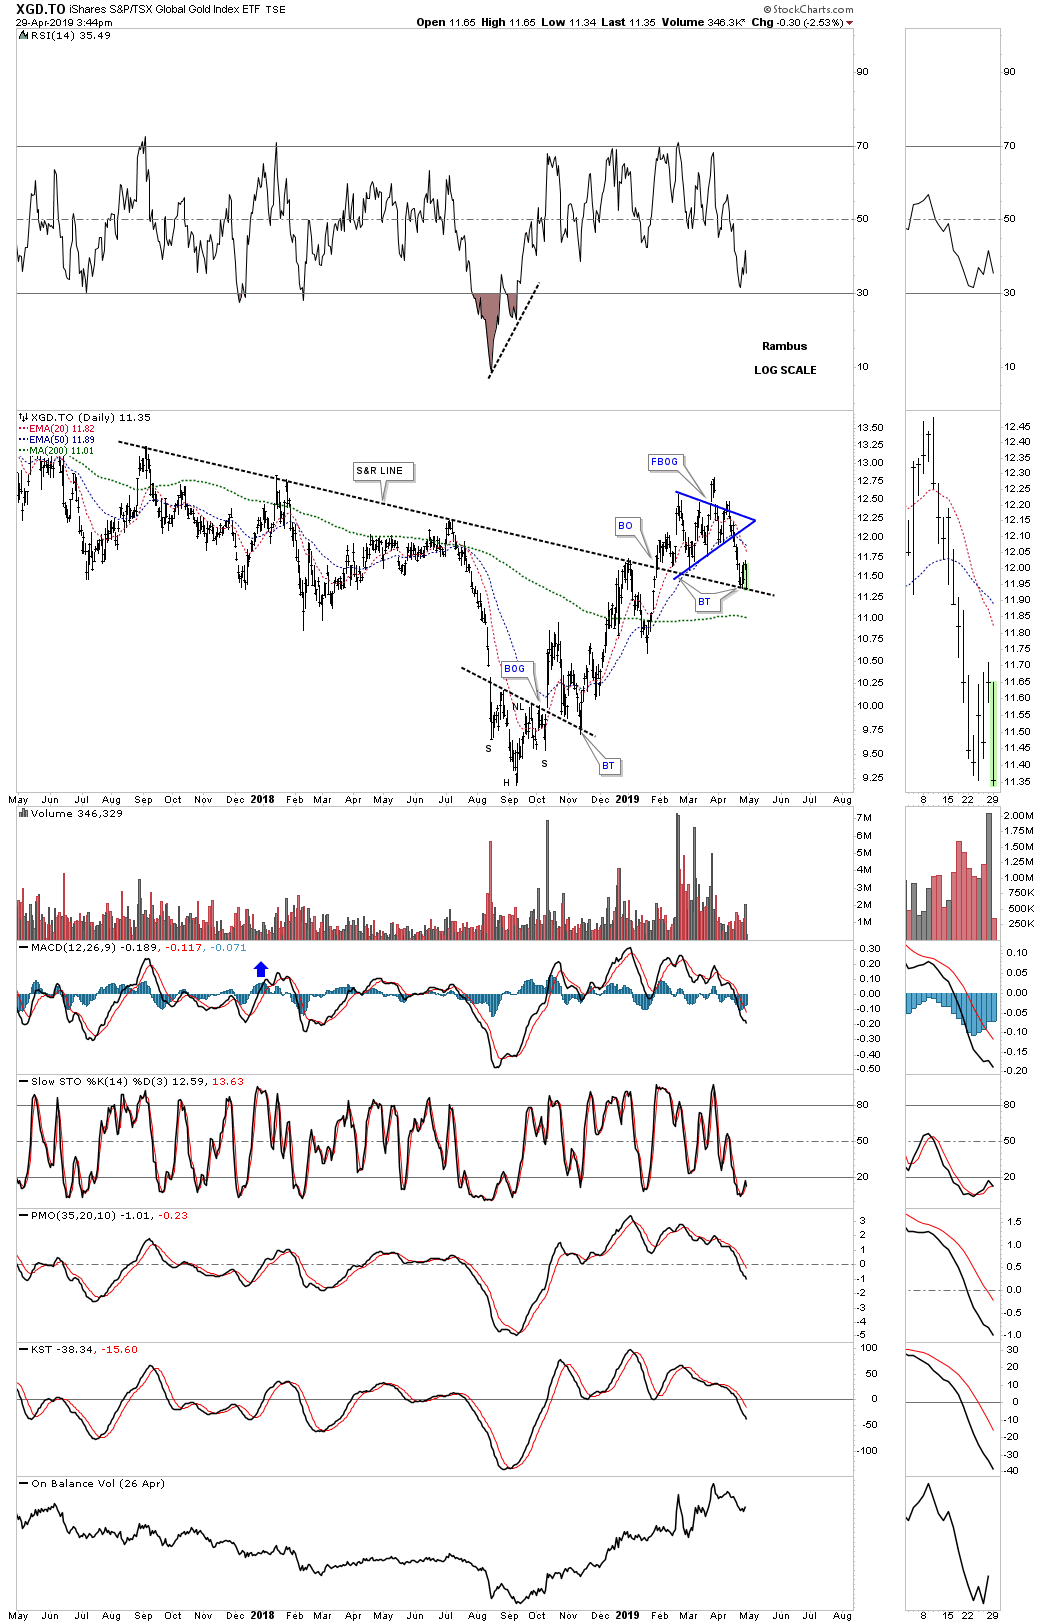
I had high hopes for XGD.TO when it broke out above its S&R line, formed the blue triangle on top and then had a failed breakout of the blue triangle, another bull trap. It’s currently sitting on the original S&R line which needs to hold support.
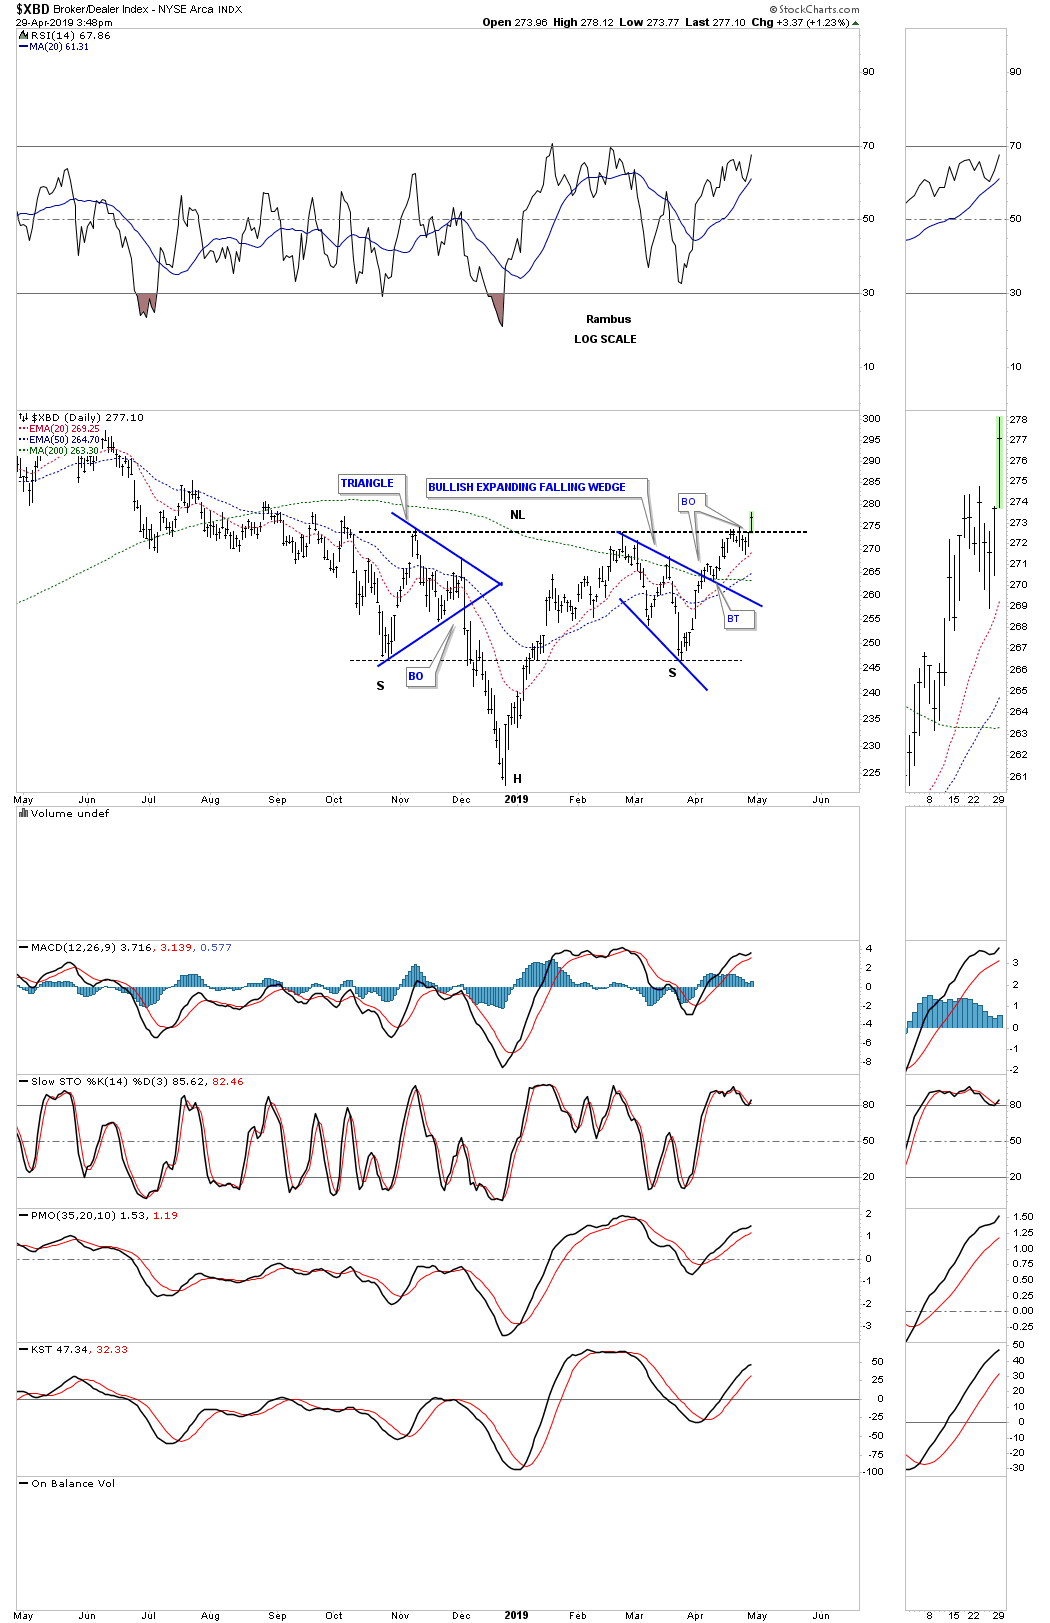
Changing it up a bit. Today the $XBD, broker and dealer index broke out of its 2018 October H&S bottom to joining the banks.
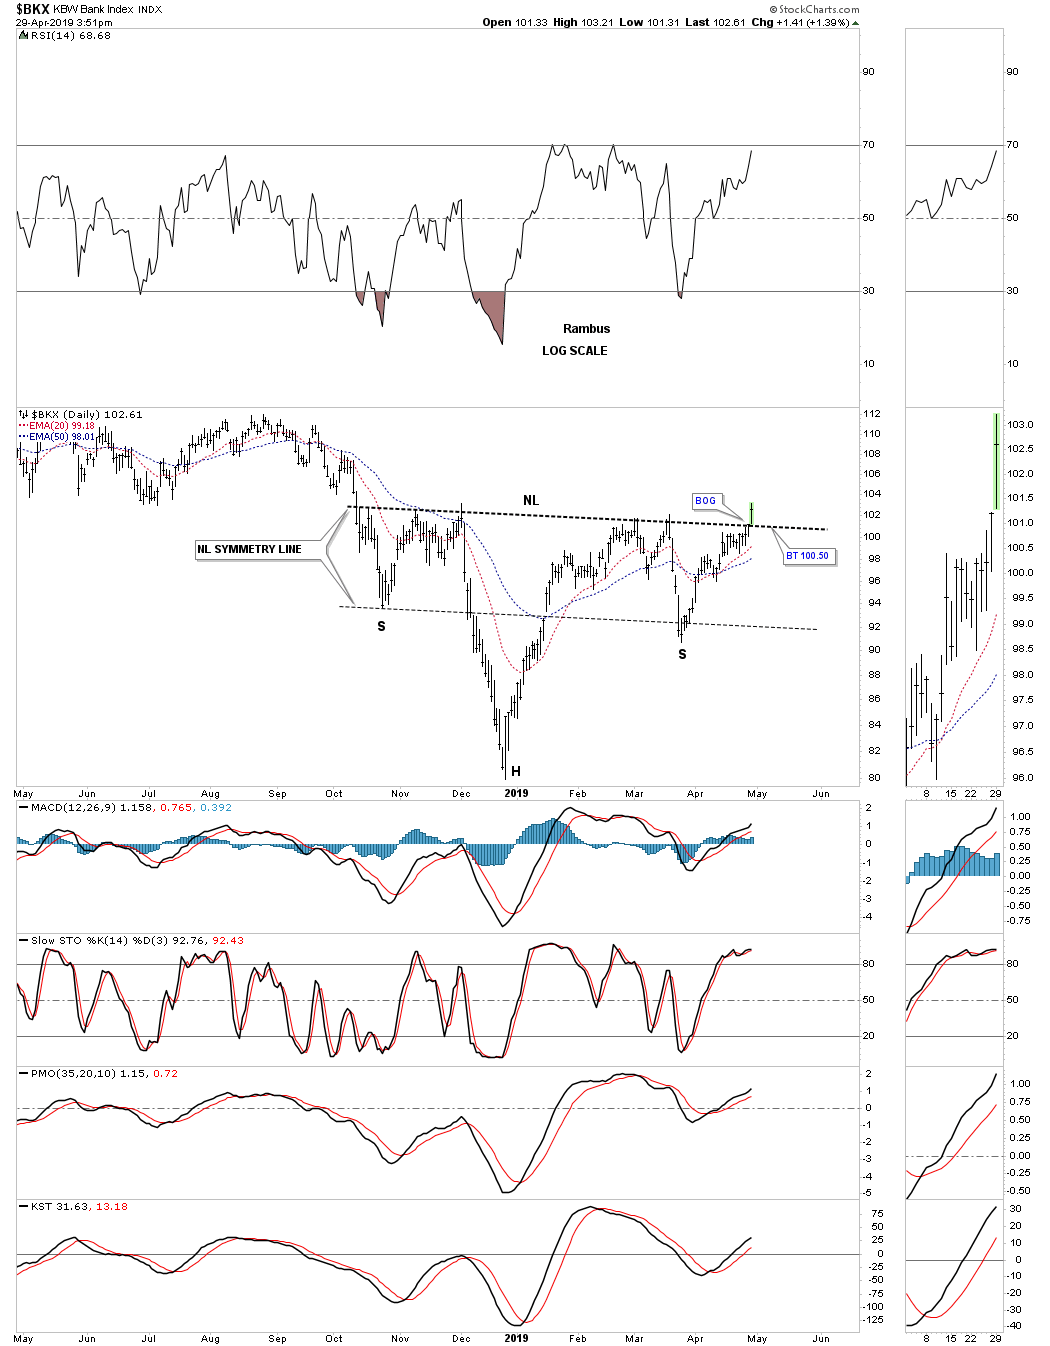
Below is a daily chart for the $BKX, bank index.
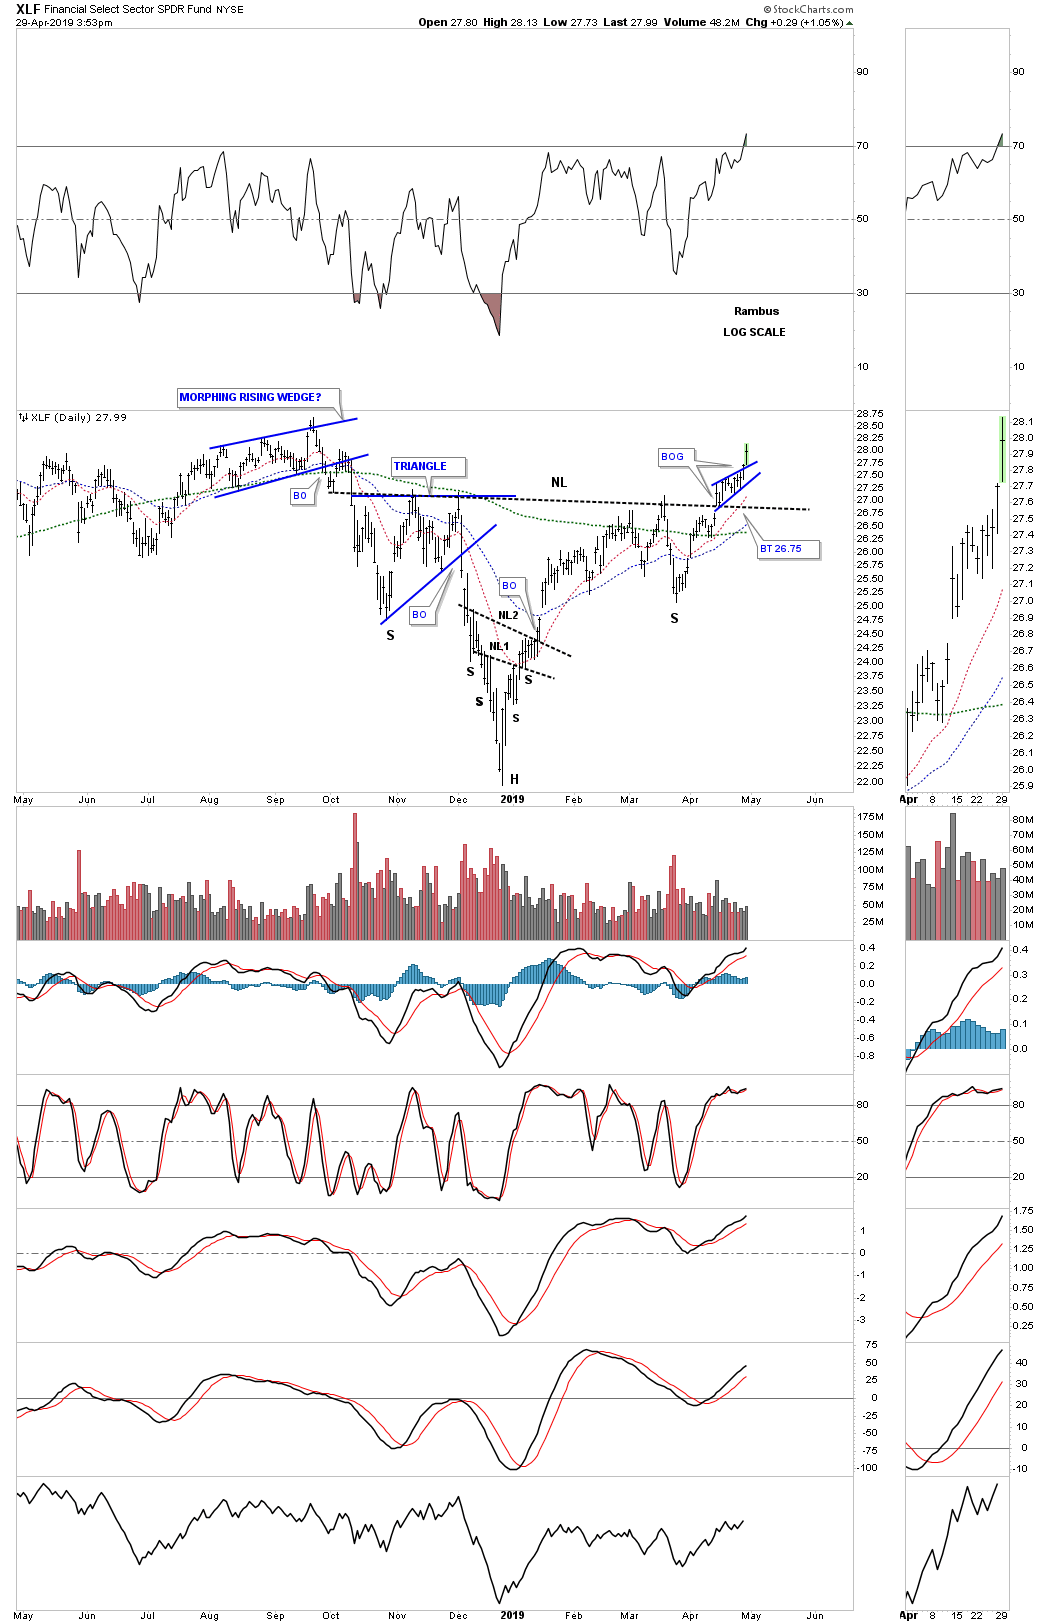
Below is a daily chart for the XLF, financial sector which built out a small bullish rising wedge as the backtest to the neckline. This is what I was looking for on many of the PM stocks I was following but they failed to deliver. You may note the the H&S bottoms on both the PM stocks and the US stock markets look very similar.