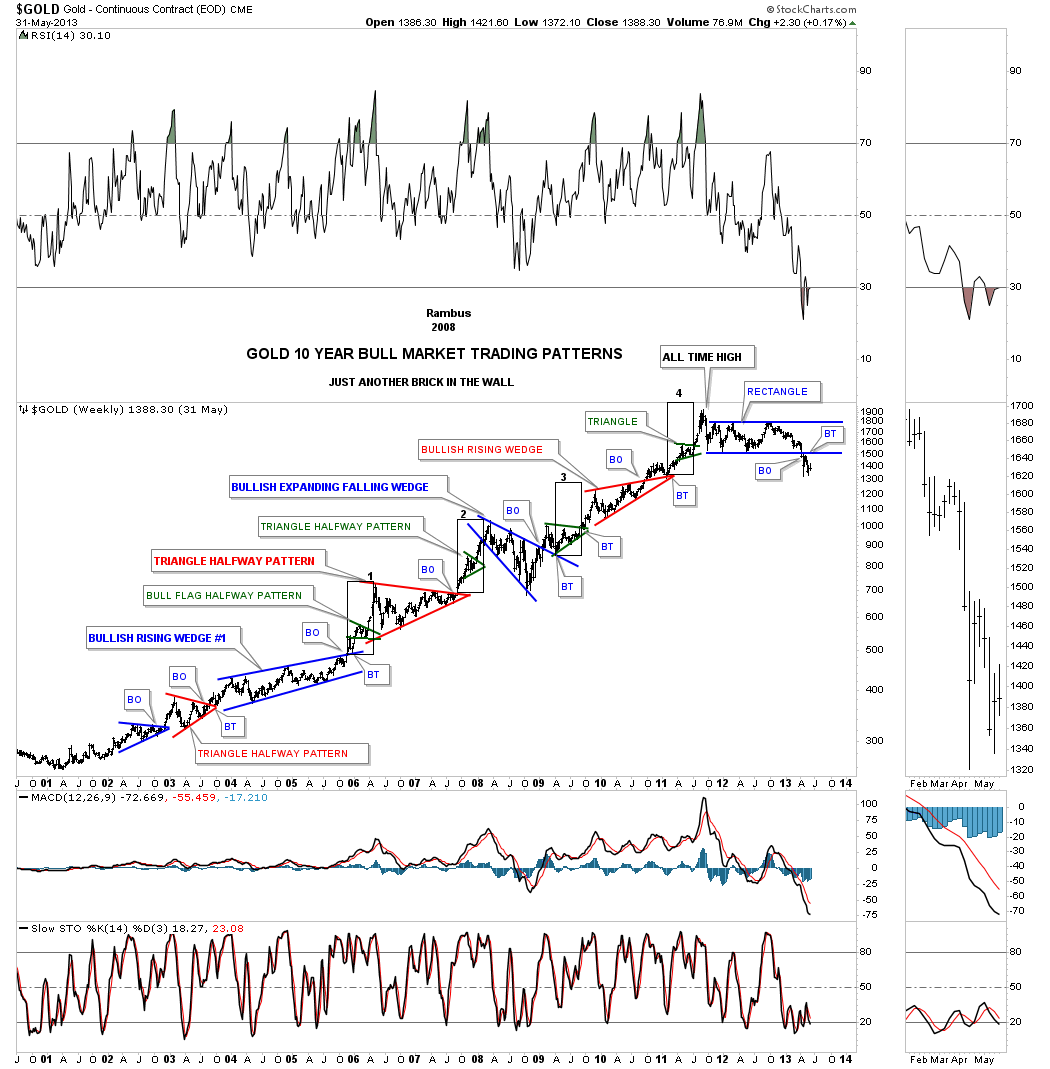
I’ve always said that gold built out one of the most beautiful bull markets of all time between the 2001 low and 2011 high. From a Chartology perspective it just doesn’t get any better. During the bull market years I called this weekly bar chart, “JUST ANOTHER BRICK IN THE WALL, because each consolidation pattern marked another brick in the wall.
The reason I’m posting this chart tonight is because we could be embarking on a similar bull market starting at the 2001 low. Take a minute and put yourself back at the 2001 low not knowing what lies ahead. As gold began to rally the first thing one would look for in a new bull market is a consolidation pattern which gold produced in 2002 that was the blue triangle. Once the price action broke out of that small blue triangle the next impulse began confirming the new bull market. From that point one had to believe in the Chartology that the major trend was up until a new lower low was put in place. As long as each consolidation pattern was followed by an impulse move up the bull market remained intact, rinse and repeat.
When you study the bull market you will see the price action always made a higher low except for the major correction in 2008 which was the blue expanding falling wedge that led to the crash in the PM complex. That 2008 blue expanding falling wedge doesn’t look like a big deal in the overall bull market but it was a big deal for the PM stocks which took a beating.
If you look real close you can see a small green triangle that formed in the middle of each impulse move up as a halfway pattern. Again classic Chartology. You can also see the thin black rectangles that measured the impulse move on the breakout from the previous large consolidation pattern labeled 1,2,3,4.
The official end of the bull market came when the price action built out the blue 2 1/2 year rectangle consolidation pattern that formed just below the all time high in September of 2011. The breakdown from that blue rectangle ushered in the great decline in 2013 confirming a new bear market had begun in earnest. There was no way to know back then how long or how low the new bear market would go only that a new bear market was in place and it was time to play by bear market rules.
When I look at the Chartology on this chart it shows me a market that is free of manipulation. Gold bugs are known for their manipulation theories on the PM complex but when I see such a beautiful bull market filled with perfect chart patterns this shows me a free market with millions of investors making a decision to either buy or sell gold and gold related assets. Manipulators would have to manipulate currencies as well to get their desired results It would be impossible to manipulate all the major currencies of the world in concert. It’s always nice to have someone or something to blame when the markets don’t go the way we think they should so we create manipulation as the scapegoat. If I thought the PM complex was manipulated there is no way I would trade this area of the markets. It would be a fools game to do so. With that said I won’t bring up the subject again. Have a great weekend and all the best…Rambus