Today we are finally getting some clarity on the August 2019 trading range for the PM complex. With just a couple of PM stocks taking out their August 2019 trading range most fell short. Looking at the daily line PM combo chart below today’s price action is showing many double top formations similar to what we saw at the August 2019 high, see thumbnail on right side of the chart. If this is correct then we should see another decline back toward the bottom of the trading range to complete the 3rd reversal point. Keep in mind we are still in the consolidation phase that is going to be more of a time thing as we have most likely seen the lows or close to the lows.
Since the 4th reversal point is always the most difficult to spot in real time I connected reversal points #1 and #3 which could show the top of the trading range. I then dragged the top rail down to the 2nd reversal point to show how the possible trading range may play out using parallel trendlines. If the consolidation pattern is going to be a triangle then we’ll see a higher low vs reversal point #2. It appears the original bigger trading range I showed last fall may be coming to pass.

Below is a daily chart for the GDXJ which shows the price action rallying right up to the top of the August trading range but couldn’t breakout. We could see some possible support as the top of the rising flag is now being tested. As you can see the Chartology did call for a move up to the top of the trading range using the blue bullish rising flag as a halfway pattern as shown by the blue arrows.
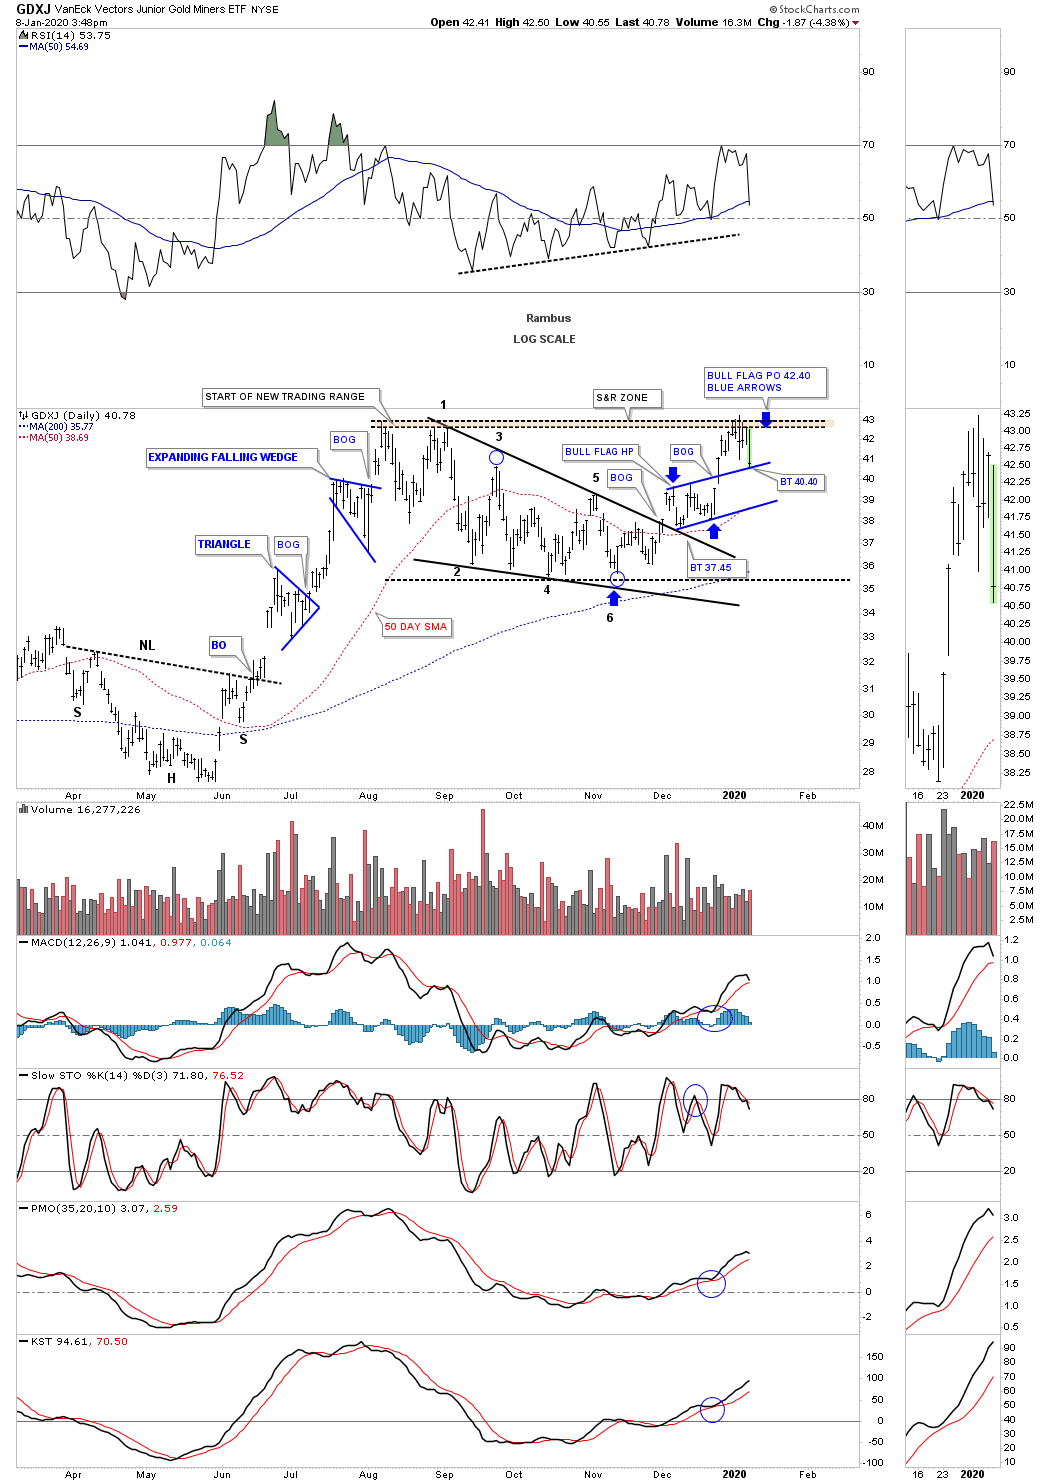
The GDXJ daily line chart.

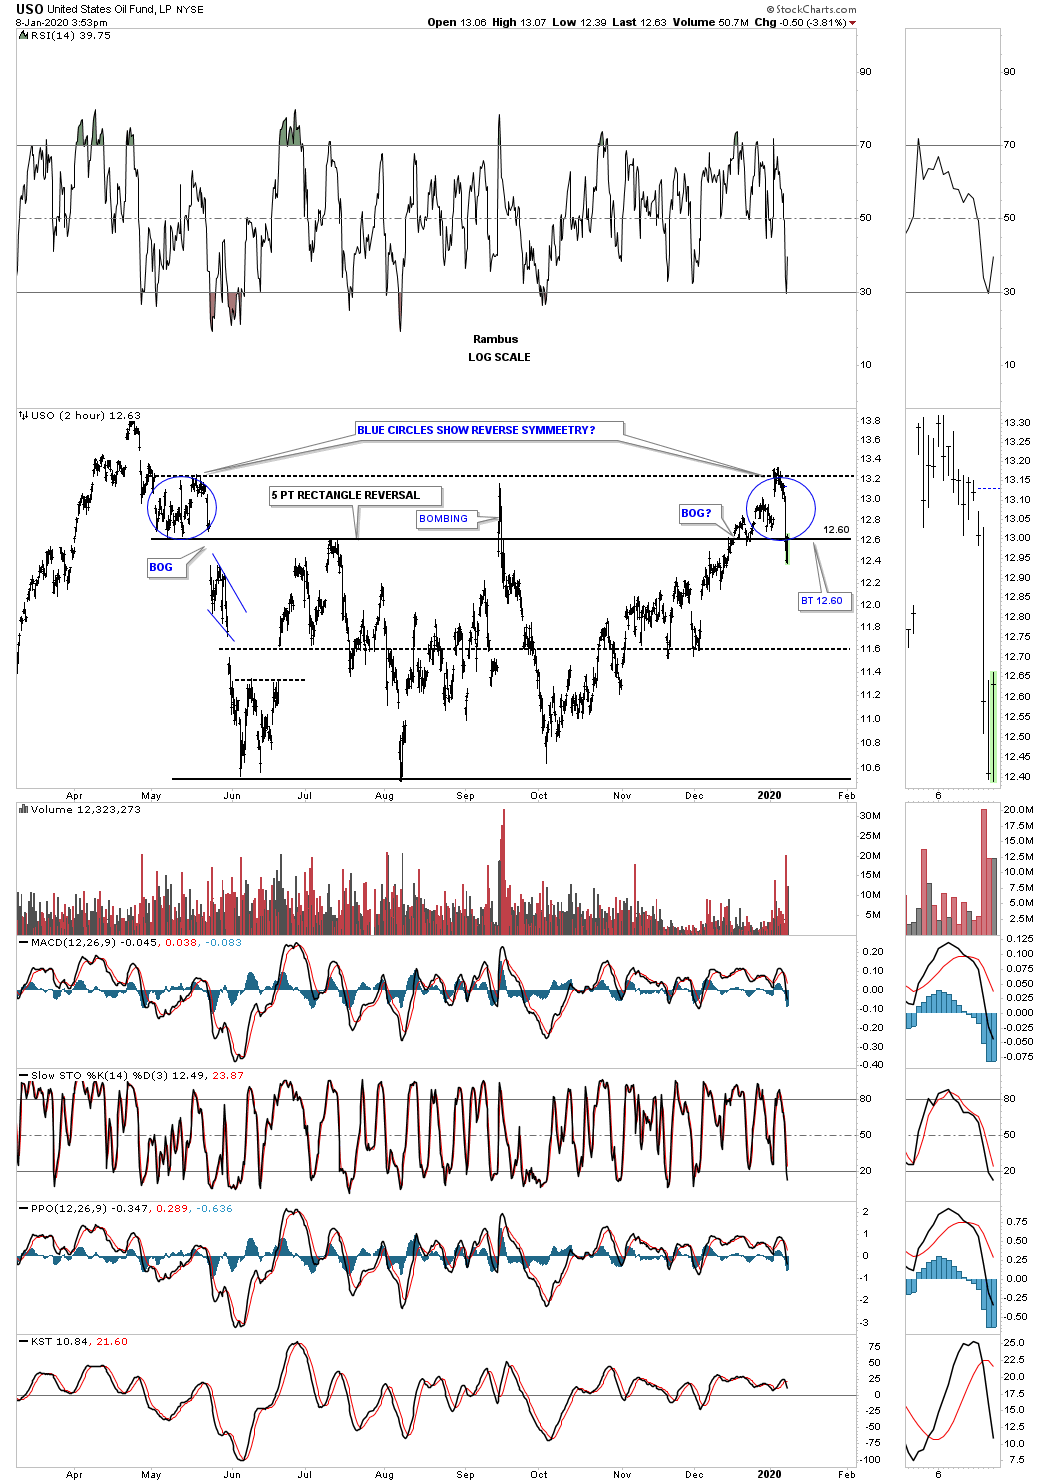
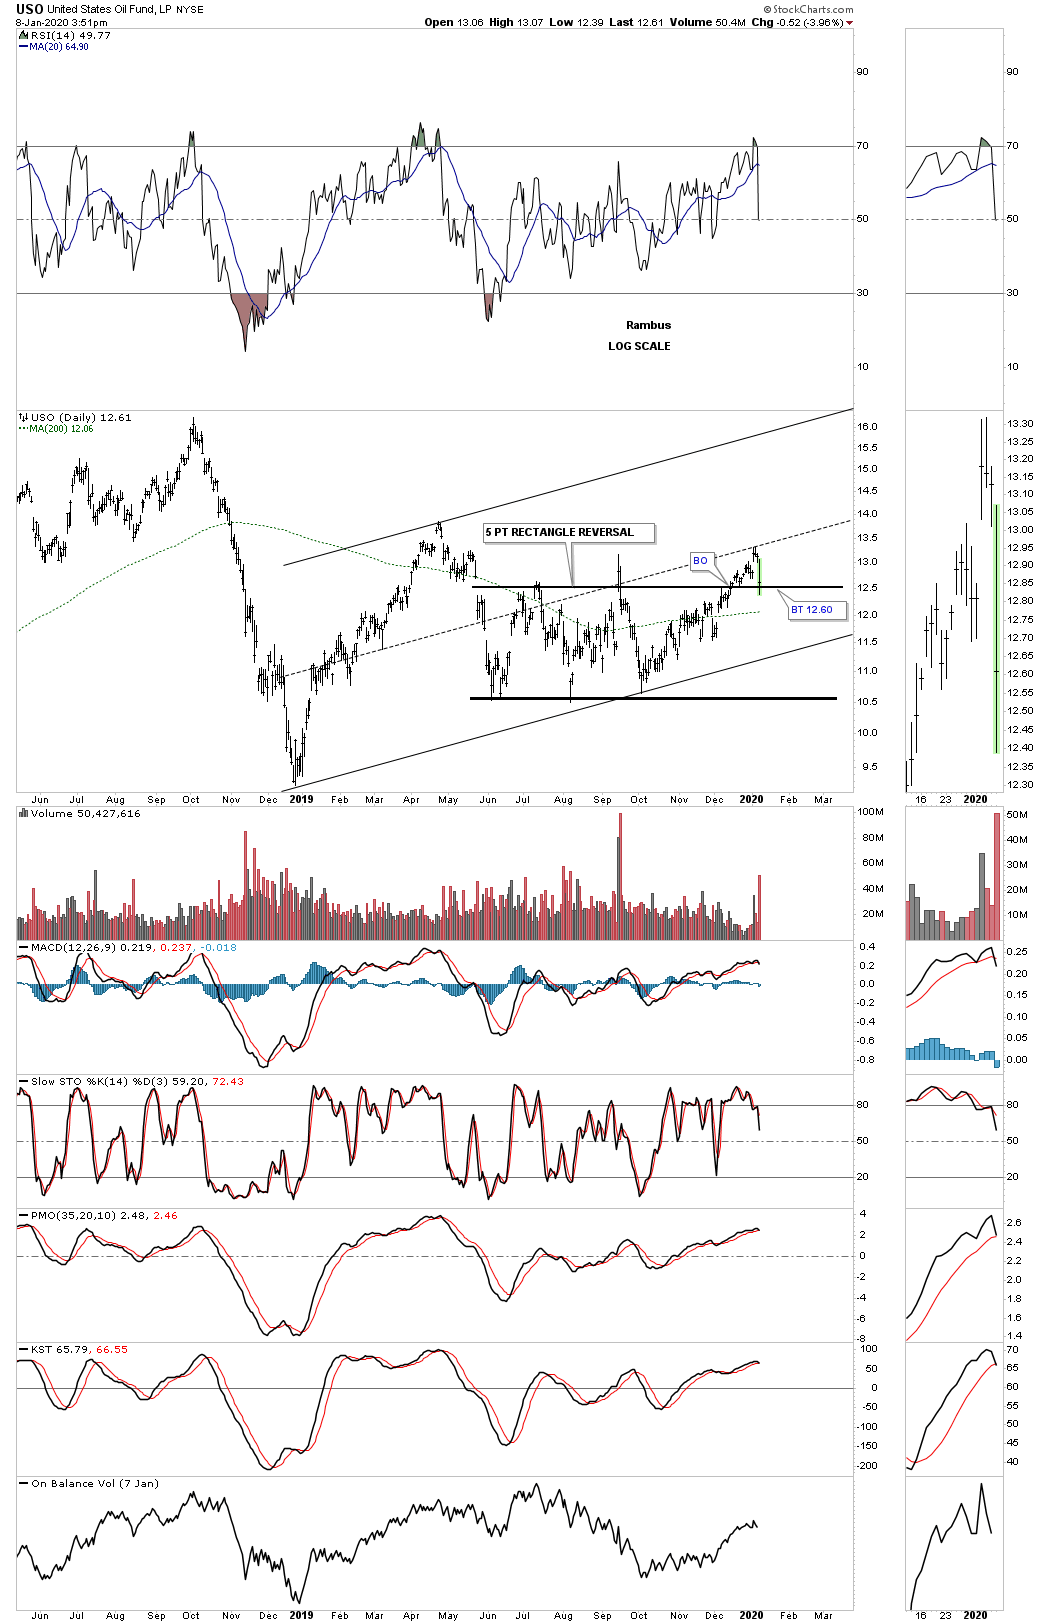
Below is a daily chart for the USO, oil fund, that had a rough day but is finding possible support on the top of the 5 point rectangle.
This 2 hour chart shows the rectangle reversal pattern and how the price action has been reversing symmetry to the upside, how it came down is how it’s going back up. The blue circles show the price action above the rectangle.