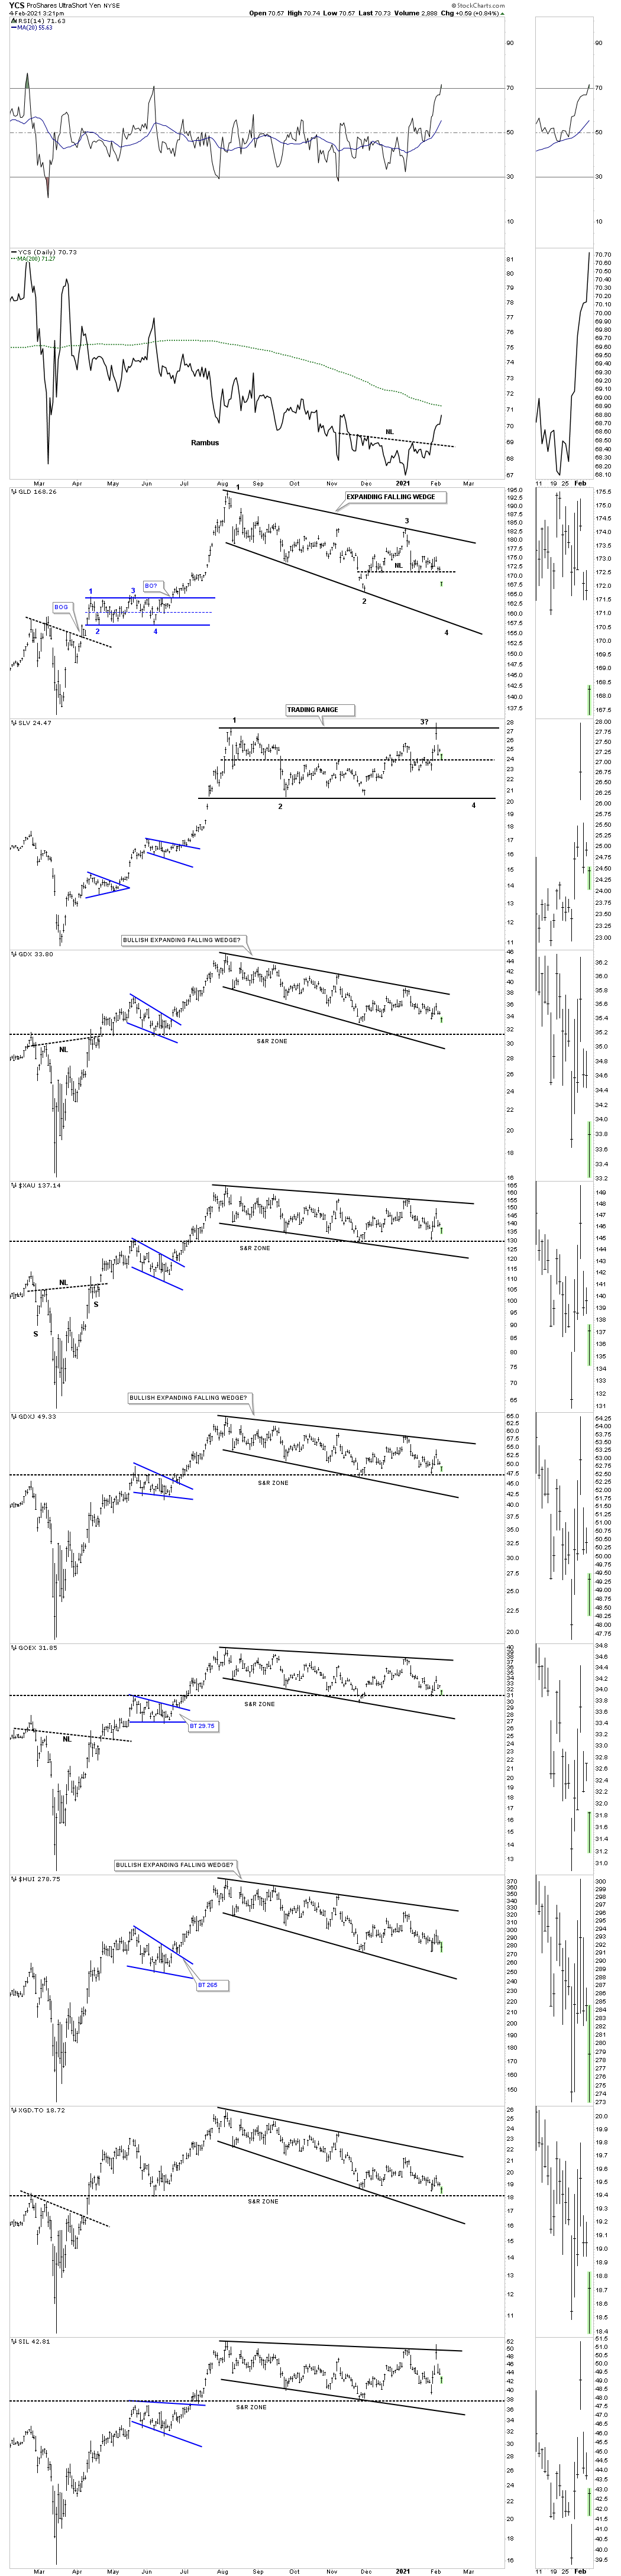
Lets start with a quick update on the daily combo chart for the PM complex which shows another day of consolidation within the August trading range with the exception of GLD which broke below its neckline today with a big breakout gap. SLV is finding some initial support at the center dashed midline of its possible rectangle consolidation pattern which needs to complete the 4th reversal point yet to be valid.
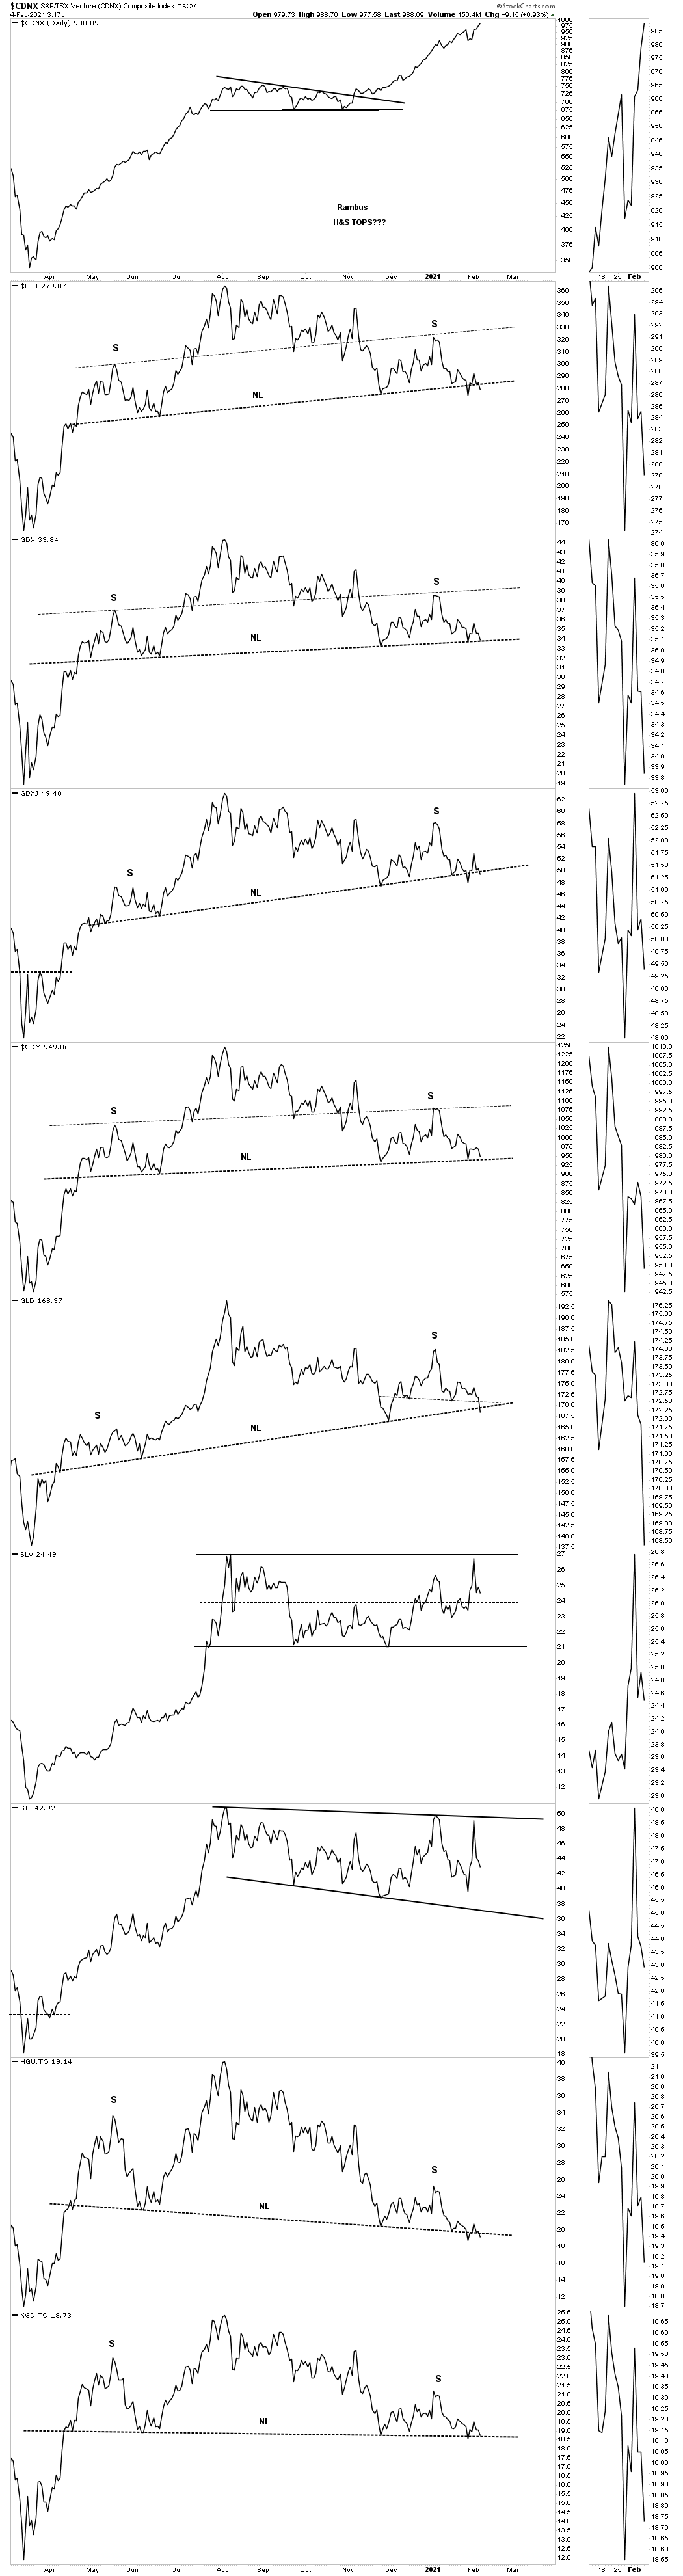
Below is the daily line combo chart showing the price action interacting with the necklines.
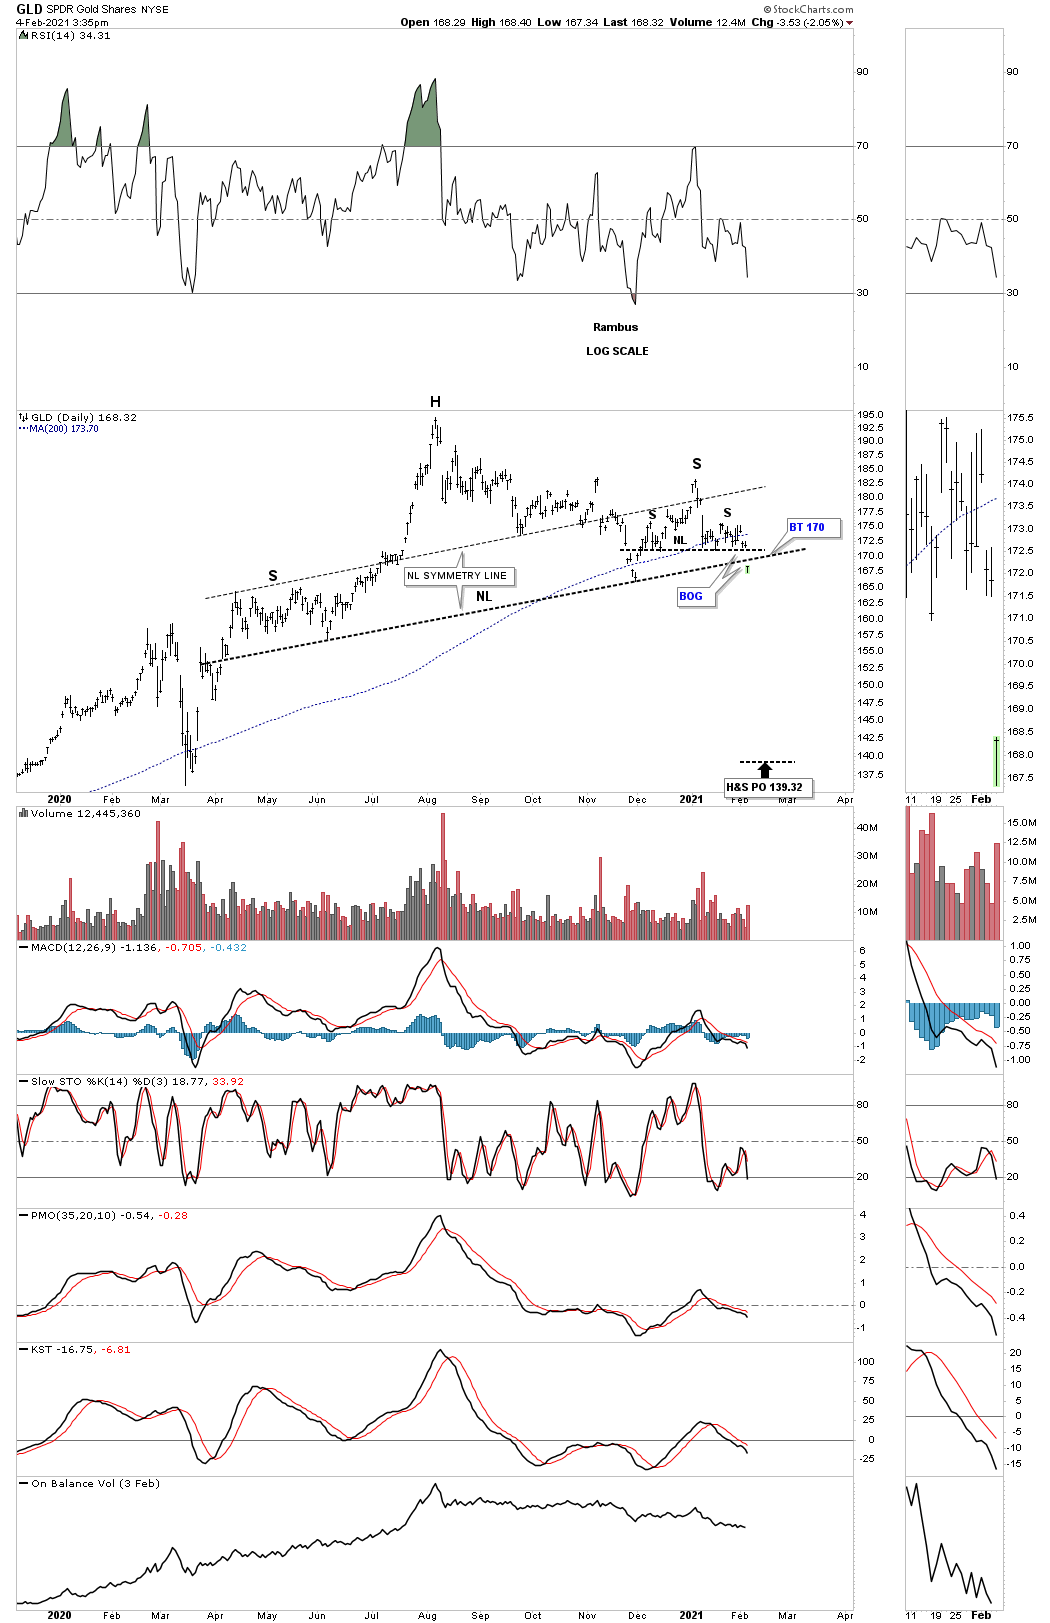
This next chart is a combo chart for GLD with a bar chart on top and a line chart on the bottom. Today’s move had all the characteristics of a breakout, with a gap and an increase in volume. A backtest to the neckline will come into play around the 172 area which will be very critical. If GLD can trade above the neckline and then higher than the right shoulder high the H&S top will be negated. On the other hand if the neckline holds resistance then the H&S price objective would be down to the 159 area.
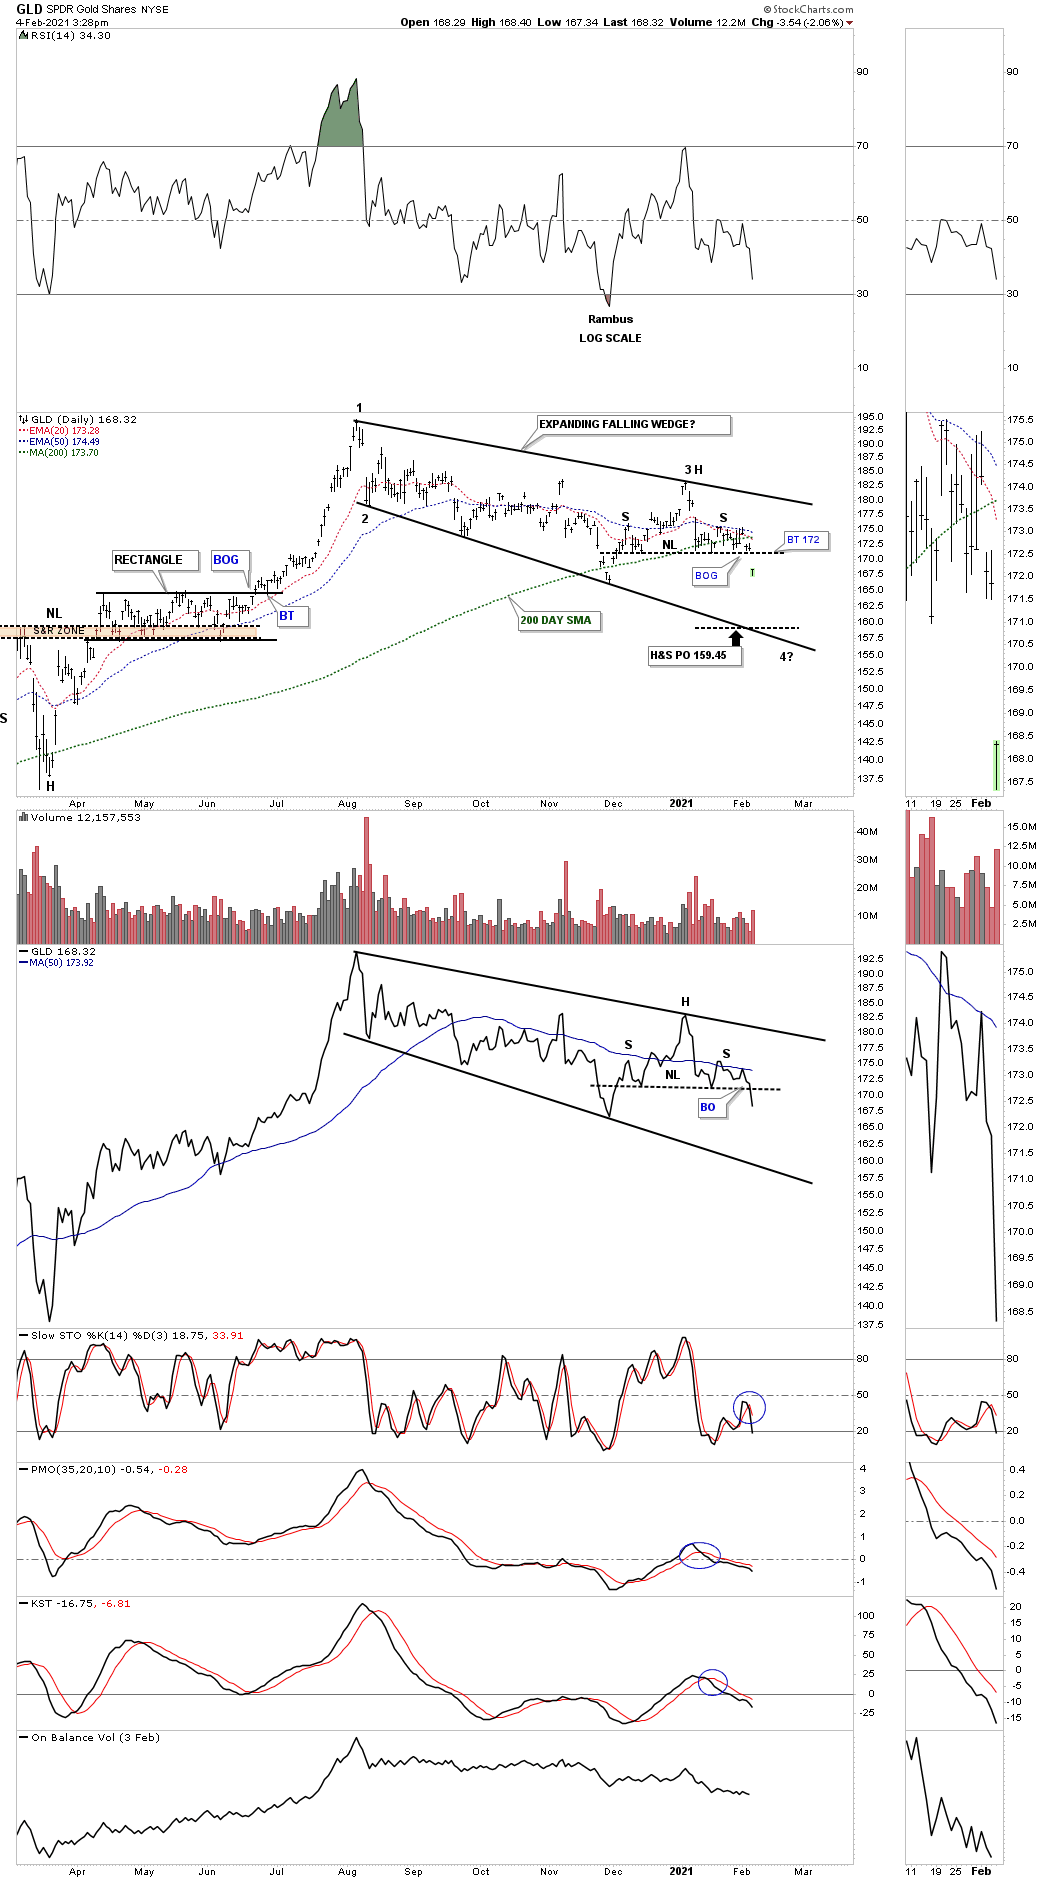
I don’t want to scare you with this next chart for GLD as it is only a possibility but I have to keep things real. The H&S top on the daily chart above could be, and I’ll say it again could be, the right shoulder of a much bigger H&S top. Note the massive breakout gap today which took out both necklines in one move. Again, lets watch the backtesting process for more clues.
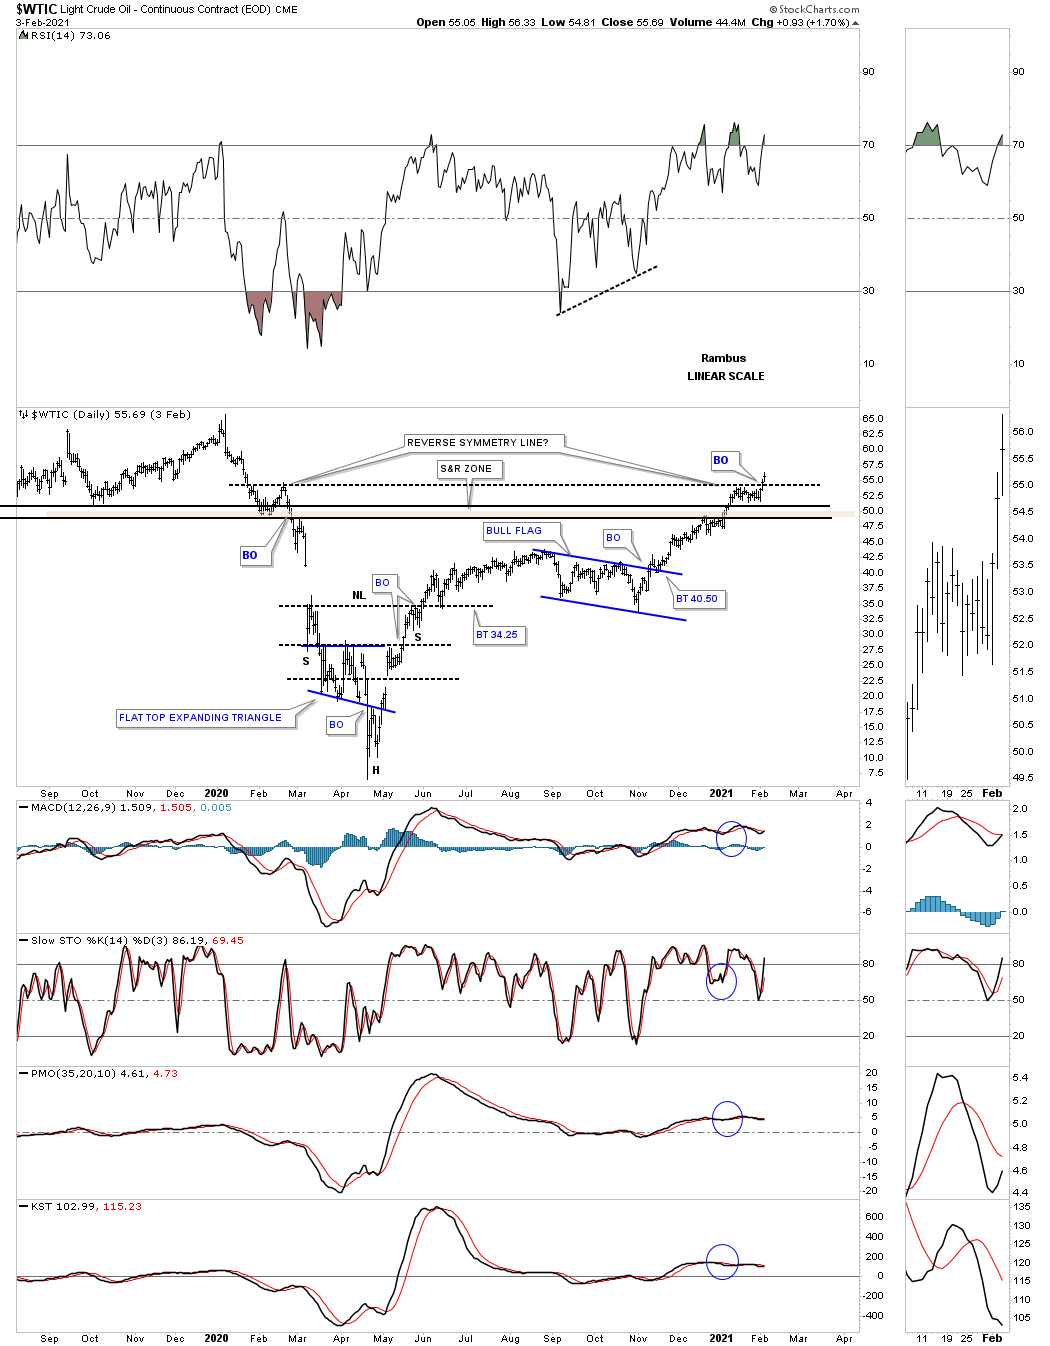
This next chart is a daily look at the WTIC oil. I haven’t posted this chart before as I was waiting to see if the symmetry was going to play out. First note the brown shaded S&R zone. On the left side of the chart you can see how the bottom of the S&R zone held support initially with a small rally and then the crash. On the right side of the chart you can see how WTIC rallied up to the bottom of the S&R zone stalled out for a couple of weeks before breaking out above the S&R zone. That move took the price action up to the reverse symmetry line which held oil in check for a couple of weeks. Today’s price action is not on this chart yet but yesterday oil broke out above the reverse symmetry line. All the best…Rambus