
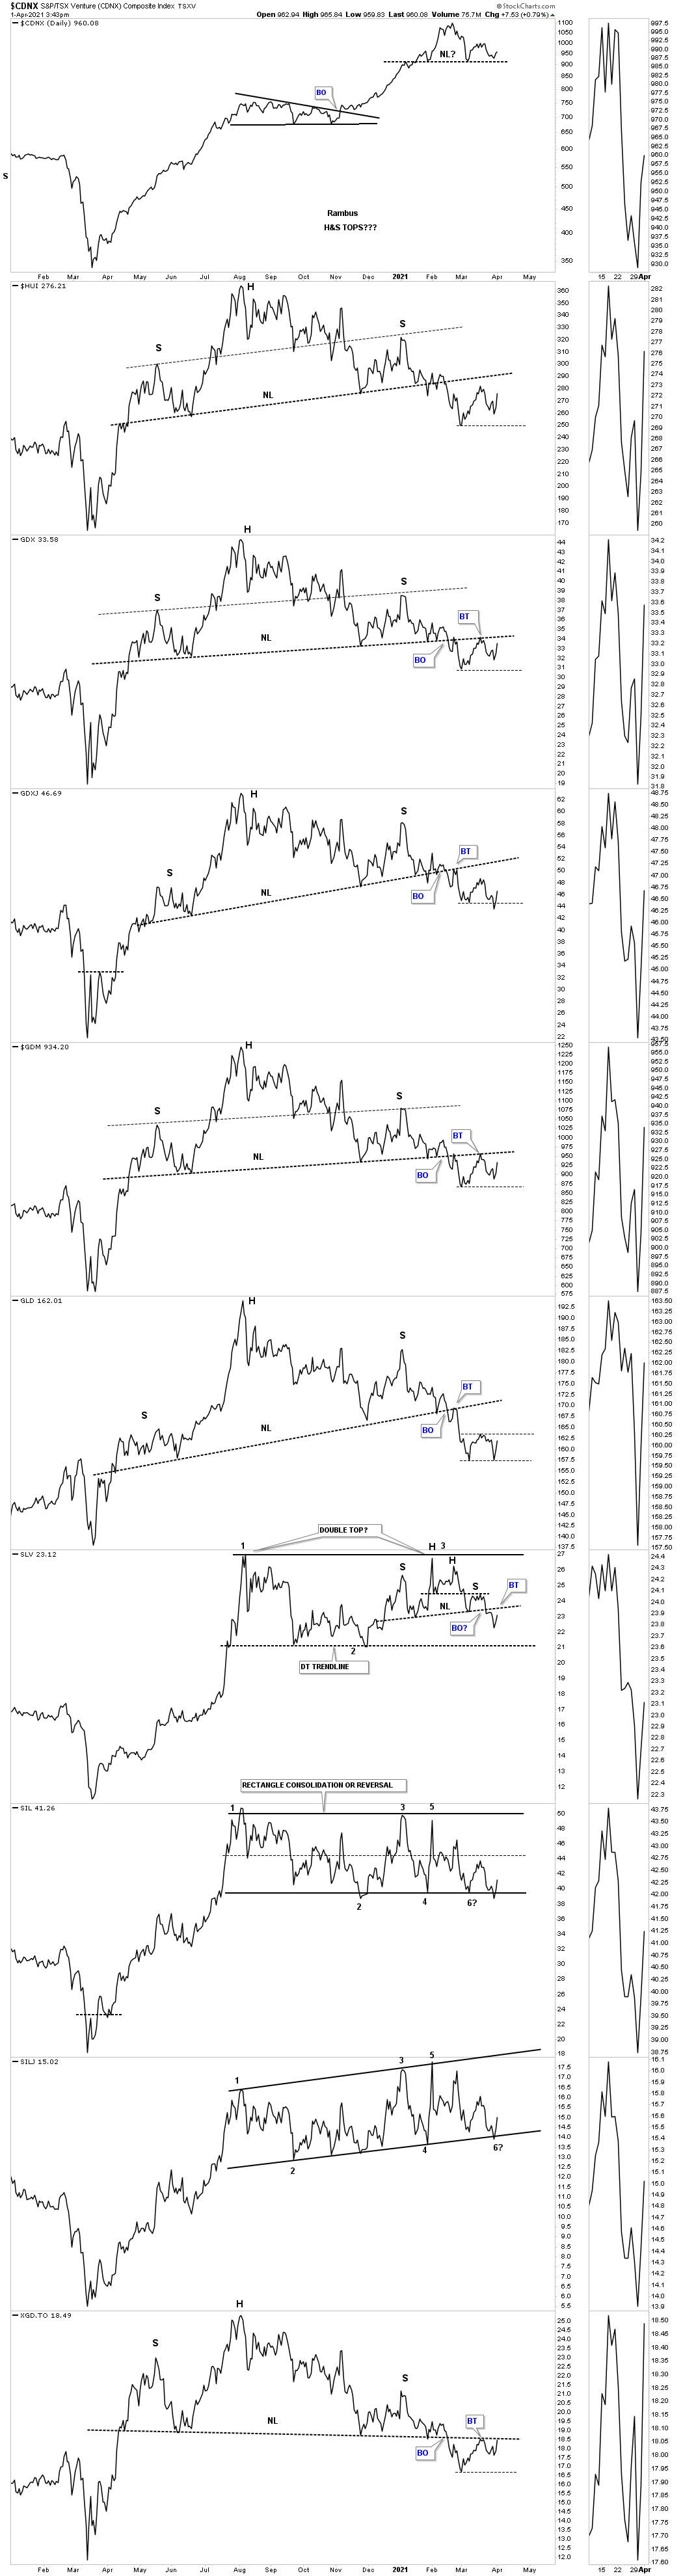
Lets start with the daily line combo chart for the PM complex which shows the H&S tops in place. Yesterday we looked at the SIL and SILJ that were sitting right on top of their bottom trendline. Today they are getting a bounce which would be normal even if they eventually do breakout below. Now we’ll find out if the bulls or bears are in charge.
GLD is either building out a small consolidation or a double bottom reversal pattern. The bulls are seeing a double bottom and the bears a consolidation pattern to the downside. Currently I’m seeing an incomplete trading range that has yet to be resolved.
SLV is still in backtest mode to its neckline.
The XGD.TO is currently the first one to test its neckline on the backtest. If the price action can trade above the NL that will be the first thing to begin the negation process. If the downtrend that has been place since August of last year is truly over we’ll see one index after another breaking back above their respective necklines.
A couple of weeks ago we were watching this daily chart for the HUI which was showing the small 2 hour H&S bottom that was forming on the bottom rail of its bullish expanding falling wedge. I was also showing the blue expanding falling wedge. As you can see the 2 hour H&S bottom failed but so far the top rail of the blue expanding falling wedge has held support. It looks like the HUI is going to close just above its 50 day ema today.

Next is the daily chart for GLD showing its H&S top and now the new blue trading range that can either be a consolidation pattern to the downside or a double bottom reversal pattern.

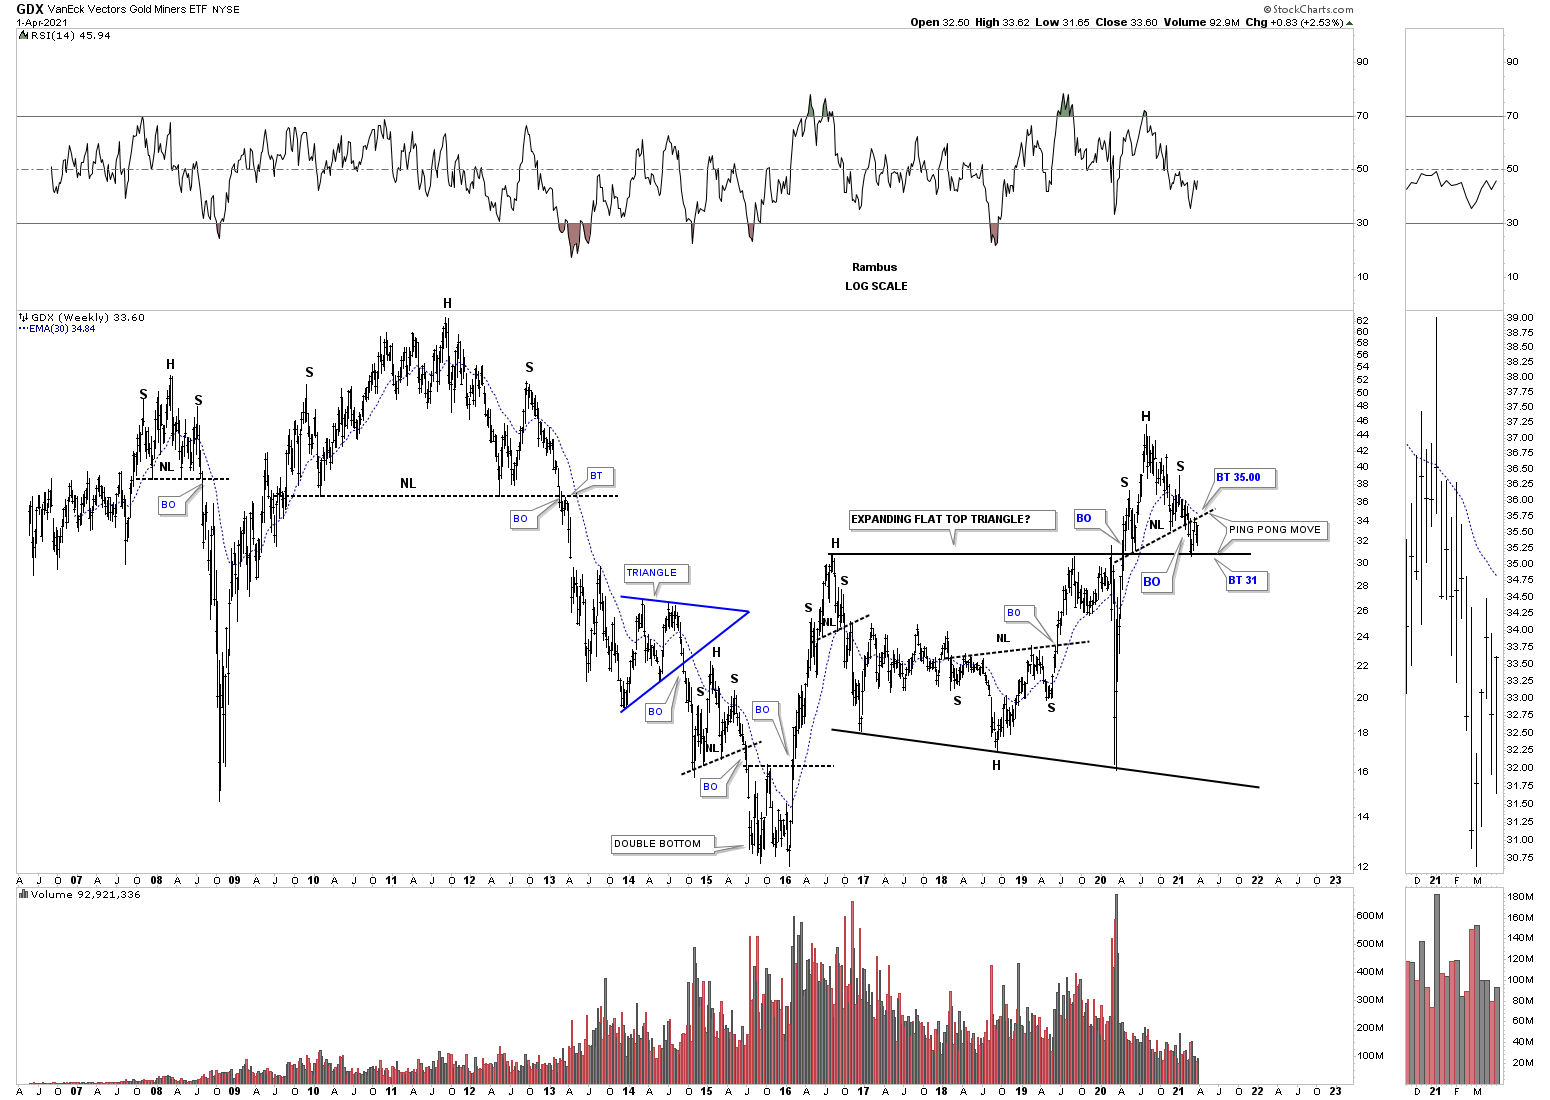
The battle between the the top rail of the 2016 expanding flat top triangle around the 31 area and the neckline now at 35 continues.
Today marks a new month of trading in the PM complex. Below is the long term monthly candlestick chart which gives us a clear picture of the 14 years of trading. About half of the indexes formed a white candlestick last month. It would be nice to see a nice big white candlestick showing at the end of April. The blue August trading ranges are also easier to see from this monthly look perspective . So far the bulls have done a good job of holding support at the tops of the 2016 trading ranges which has always been on our radar screen until the H&S top showed up which has put a kink in the overall game plan for the time being. All the best…Rambus
