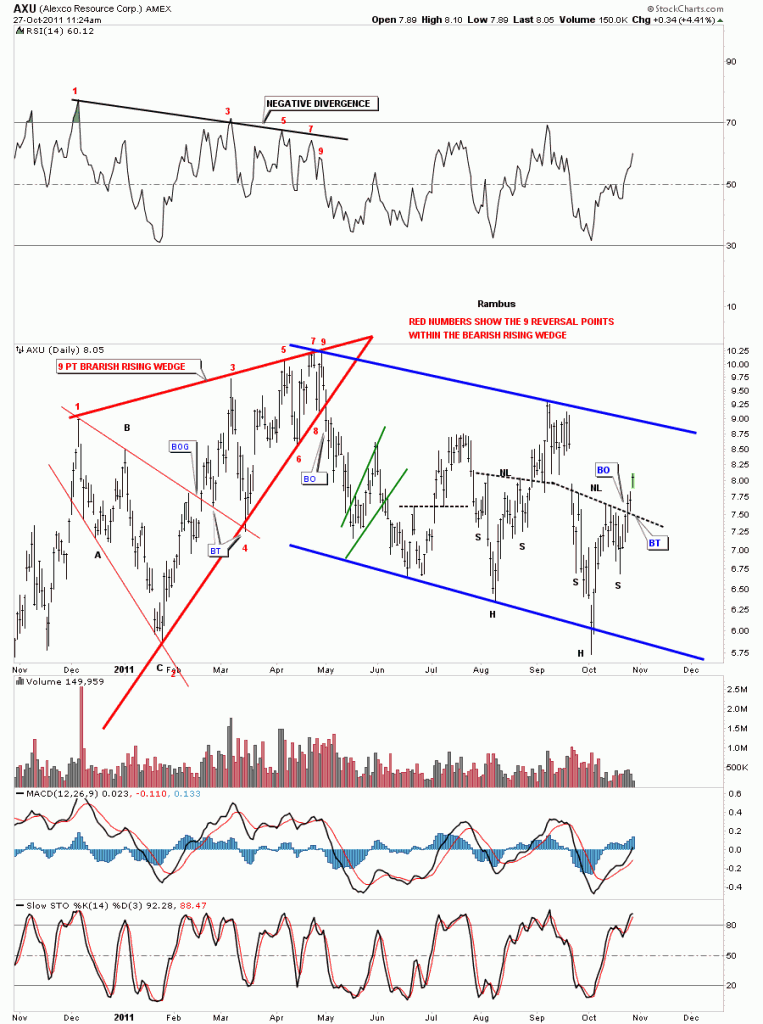
If the precious metal stock indexes are making H&S bottoms then it stands to reason that many individual stocks will also be making the same pattern. AXU is a good example of a completed H&S bottom. AXU broke the neckline 3 days ago. If you remember the sharp shakeout yesterday morning, after a very good open, alot of precious metals stocks did their backtest to the neckline to complete the breakout. H&S patterns are the most useful chart pattern to show reversals, either up or down. If you see one don’t ignore its implications for the stock or index as these are very powerful reversal patterns. H&S patterns also are good for measuring the future price objective of the underlying asset.
AXU daily H&S breakout.

