Before we look at the charts I’m going to hold all my PM positions into tomorrow toward the end of the day trading to make a judgement if this is the beginning of something or the end of something. It is not unusual to see a couple of hard down days to shake out the weak hands and today is day #2 if this is just a shakeout. There is no doubt there was some damage done to the PM complex charts today that may need some time to heal unless this is a shakeout move.
Lets start with the daily chart for GLD which shows the massive gap below the top rail of the expanding falling wedge which leaves an island reversal. I extended the double bottom trendline to the right side of the chart which GLD found today.

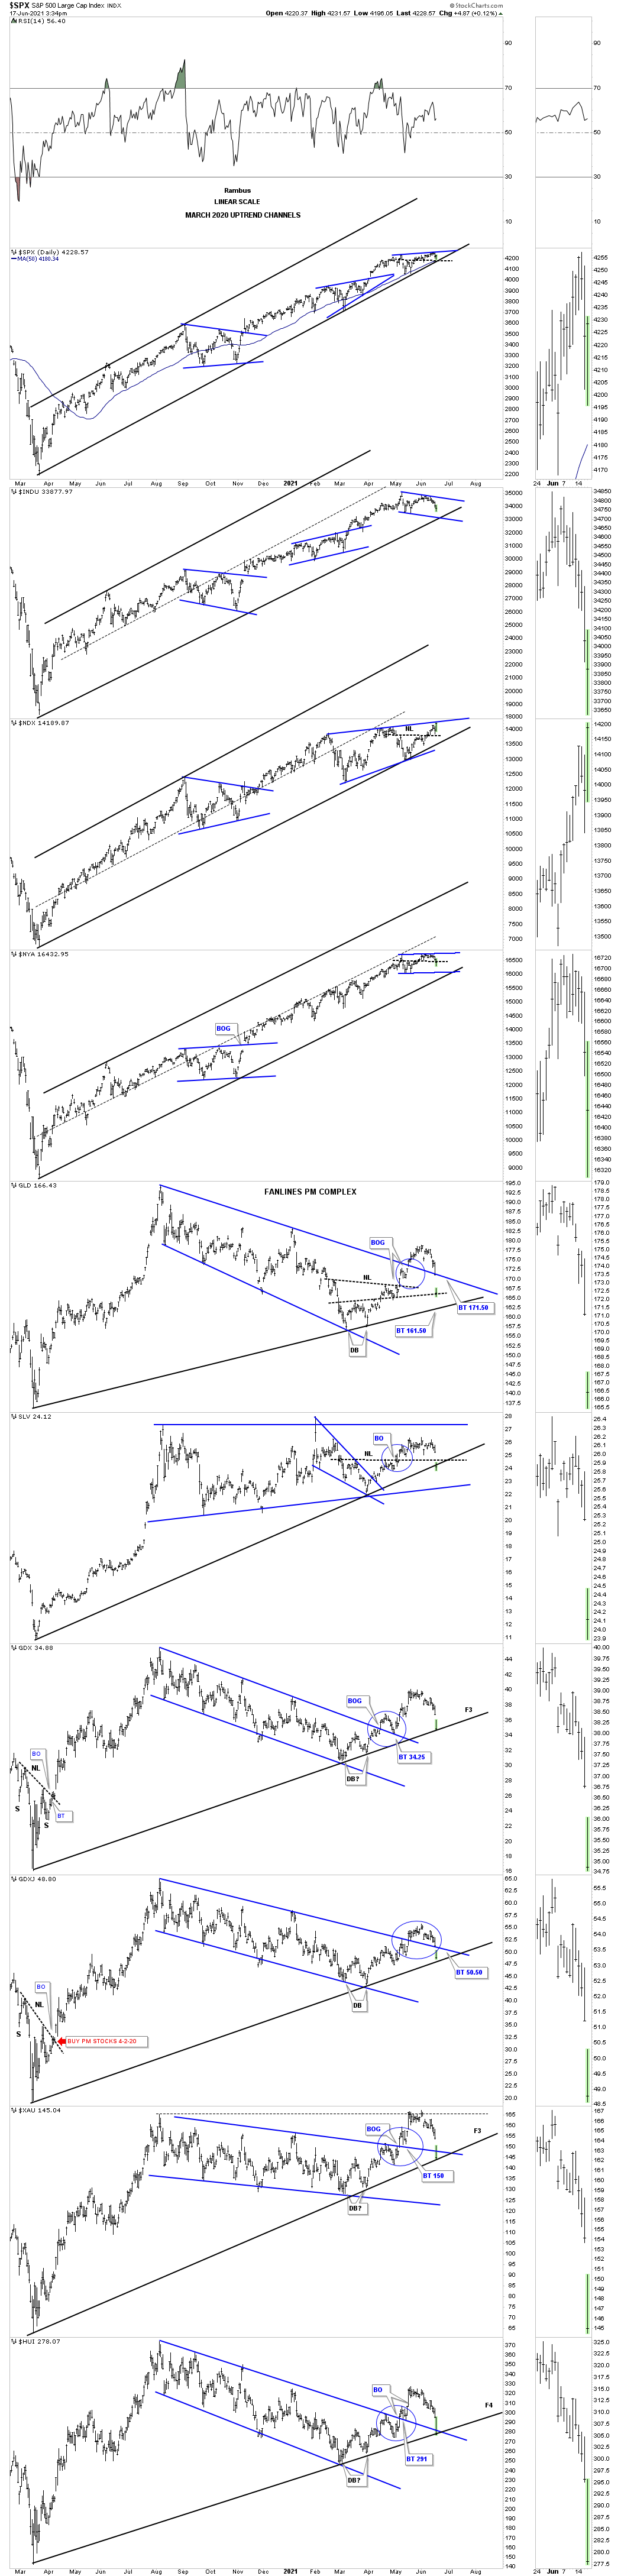
This next chart is the daily combo chart which has some of the US stock markets on top with some of the PM indexes below. This combo chart is in linear scale and shows the March 2020 uptrend channel in both the US stock markets and the PM complex. We should know fairly soon if the bottom trendline of the 2020 uptrend channel is going to hold support in all cases cases especially for the PM complex.
I’ve mentioned several times that their has been a lot of rotation taking place in the US stock markets where some sectors that were leading cooled off to consolidate their gains while some of the weaker areas took up the slack and had their own rally. It now looks money is rotating back into the stronger areas like the NDX which is going to close at a new all time high today just below the top rail of its potential bullish rising wedge.
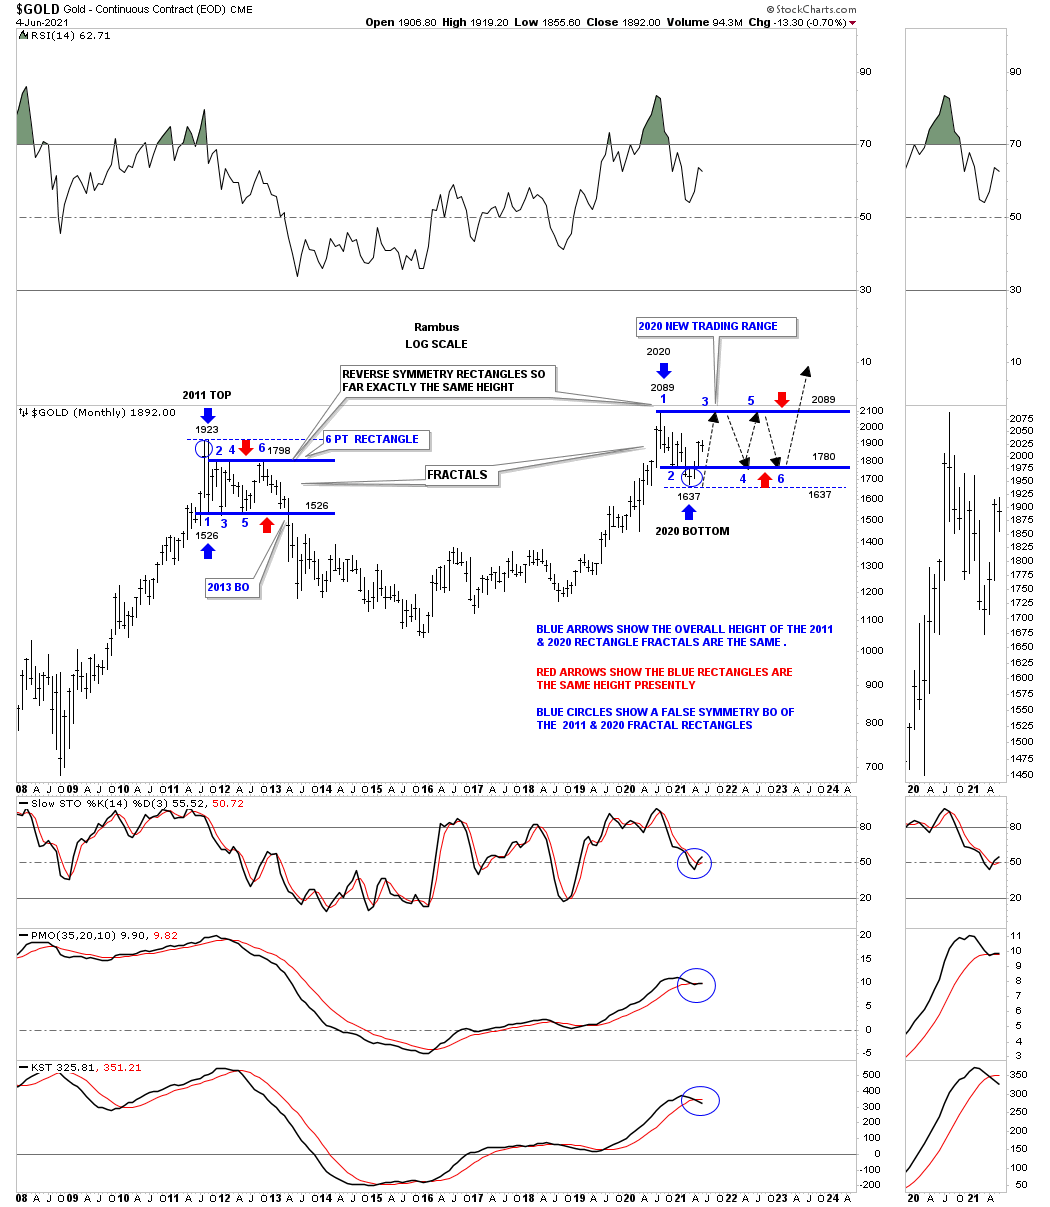
Now for the big picture. Back on June 6th of this year I showed you a possible fractal which compares the 2011 six point rectangle to our current sideways trading range.
June 6th 2021:
Below is the updated version of the 2011 & 2020 reverse symmetry rectangle fractals. Why do I call the 2011 and the possible 2020 fractals, is because the overall patterns are the exact same height as shown by the blue arrows while the rectangles themselves are the exact same height as shown by the red arrows. The blue circles show a false symmetry failure of the top rail of the 2011 rectangle and a symmetry failure below the bottom rail of the 2020 potential rectangle.
To really show you how very similar these two rectangles are, at least at this point in time, is to take the 2020 rectangle and flip the bottom to the upside where the blue circle at the bottom is now on top. At this point you could lay the 2020 rectangle on top of the 2011 rectangle and they would match up perfectly. So the 2011 rectangle was a consolidation pattern to the downside while the 2020 rectangle should be a consolidation pattern to the upside.
The bullish scenario here is that if Gold keeps building a similar fractal to the 2011 fractal then Gold is in a very large trading range which is big enough to trade. We already have taken a position in UGL which would be toward the bottom of the current trading range. If that is the case then the top of the rectangle would come in at the all time high around the 2089 area where we will have to decide to take profits and even go short for a ride back down to the bottom of the potential rectangle fractal.
If that is the case then we’ll look for some type of small reversal pattern to form at the top of the rectangle at the possible 3rd reversal point similar to the H&S bottom we’ve been following currently in the PM complex. This would be the first bullish scenario.
Today June 17th.
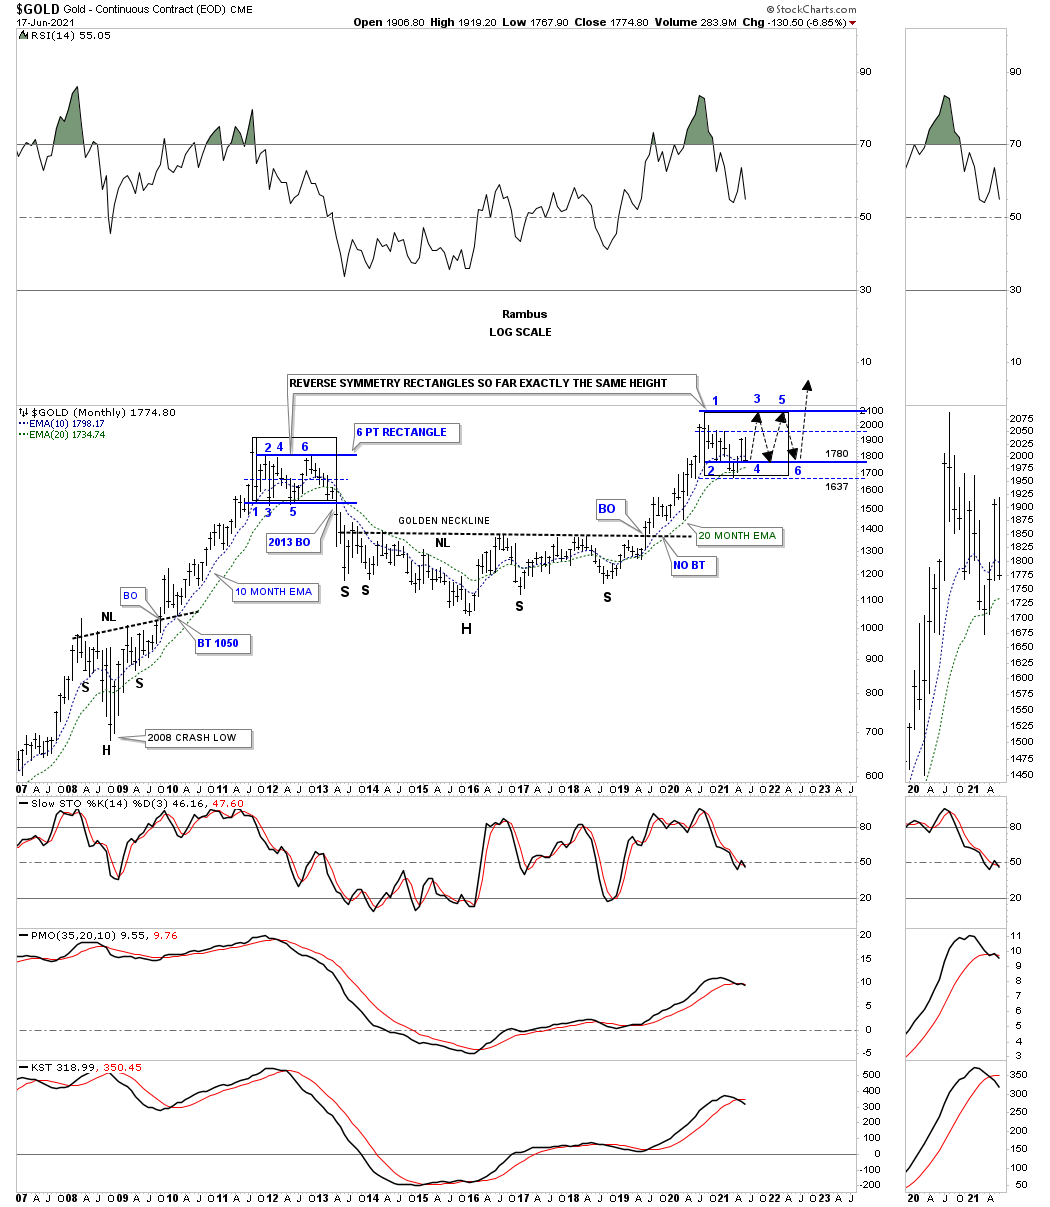
What the possible gold fractal chart above is showing us is that if the current sideways trading range is inverse to the 2011 rectangle fractal then the bottom for Gold will not be the very bottom of the current sideways trading range at 1637 but the solid blue trendline at the 1780 area.
Below is the updated chart which shows todays low has touched the 1780 horizontal trendline. If this possible fractal is going to play out this area should be the bottom followed by a rally back up to the all time high around the 2089 area. If you look closely you can see a black rectangle I put around the 2011 rectangle and transported it to the current trading range which shows time and price. If our current fractal plays out like the 2011 rectangle, time wise we are looking at April of 2022 to complete the current trading range. Price wise we already have the high and low points in place. Let me just say, fractals never play out exactly but they can be a good guide in a situation we currently find ourselves in. Lets see what tomorrow brings.
What is also important to note is the placement of the 10 and 20 month ema’s which have done a good job of holding support during the previous 2000 bull market and our current bull market.
All the best…Rambus