
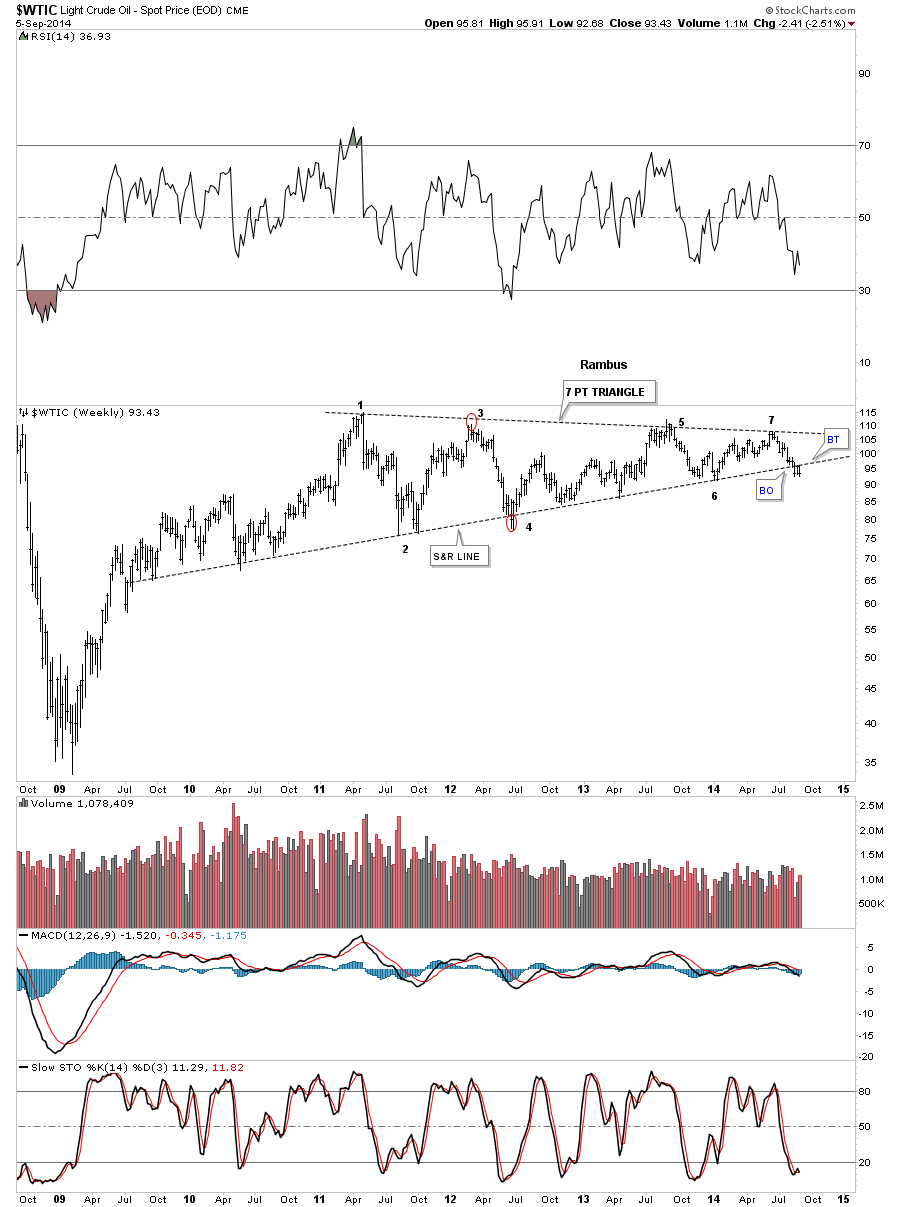
Tonight I would like to show you a few Oil charts as its been fairly volatile lately. There are several big patterns in play that have been forming for many years. This first chart is a long term weekly look that shows several potential patterns forming. On this chart below I’m showing the bottom rail as a five year support and resistance line. Notice how many times that bottom rail has been hit over the last 5 years. Three weeks ago Oil broke below that bottom S&R line and has been in the process of backtesting from below. So far it has held resistance. I can also make a case for a big 7 point triangle reversal pattern as shown by the numbers.
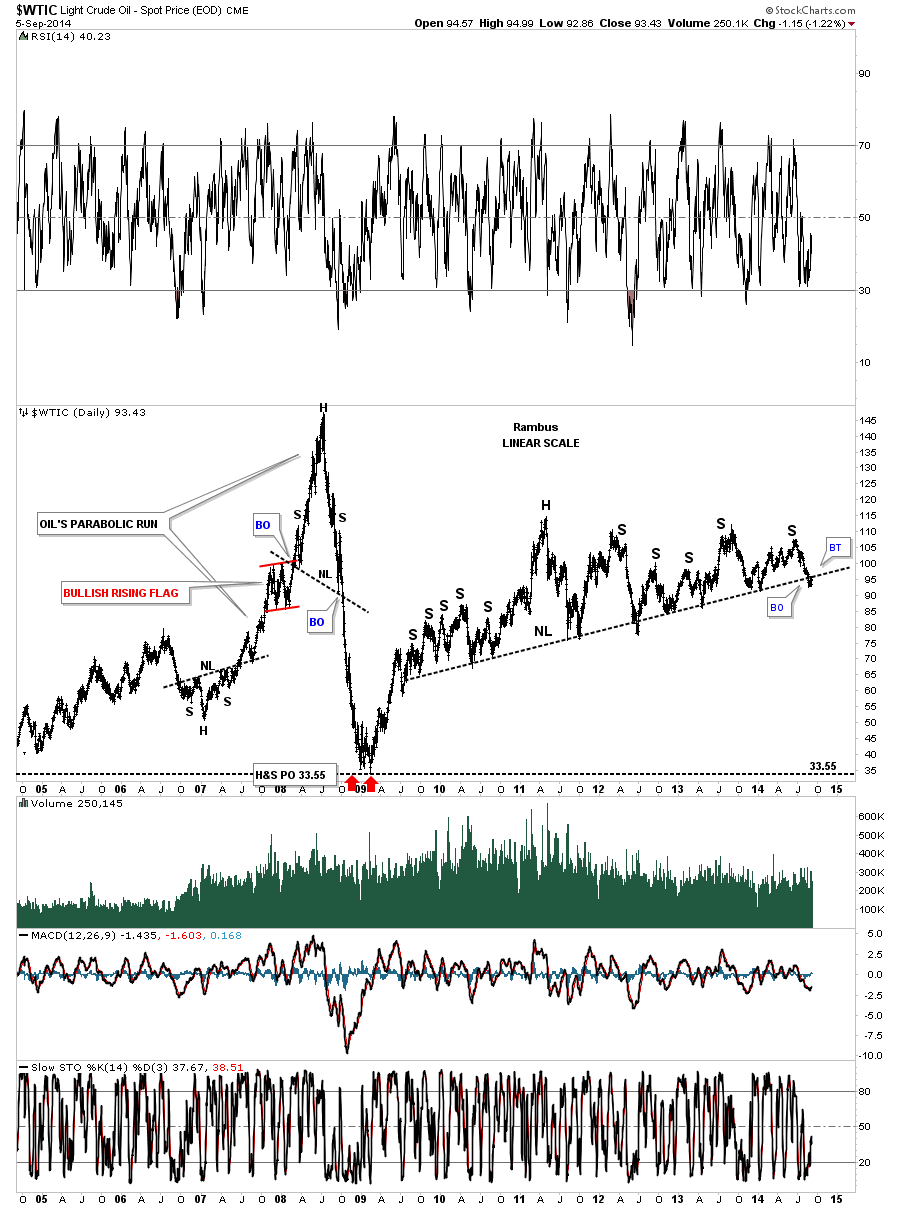
This next chart is similar to the one above but goes back further in time that shows Oil’s parabolic run, the crash and the potential massive unbalanced H&S top. This chart is a good example of what can happen after a stock goes parabolic.
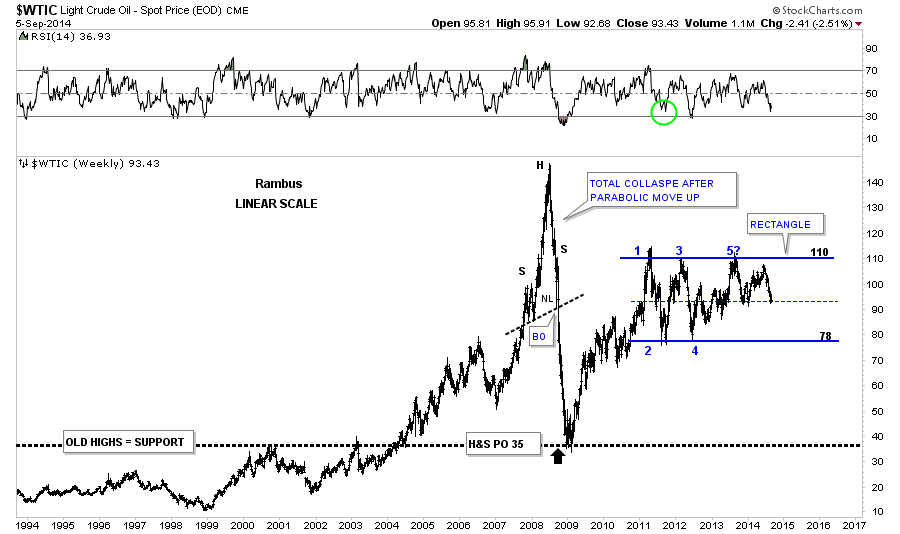
Below is another long term look at Oil that goes back over 20 years that shows another possible pattern that has been forming since 2011 the blue rectangle. I’ve taken the liberty to draw in the horizontal top and bottom rails that really shows where support and resistance lies. Sometimes on big patterns like this I’ll give the area of support and resistance a little more leeway because of the distance between the reversal points. Here again you can see the parabolic rally and the parabolic decline that found support at the previous all time highs at 35. The 35 area reversed its role from what had been resistance for the history of oil to support during the crash.
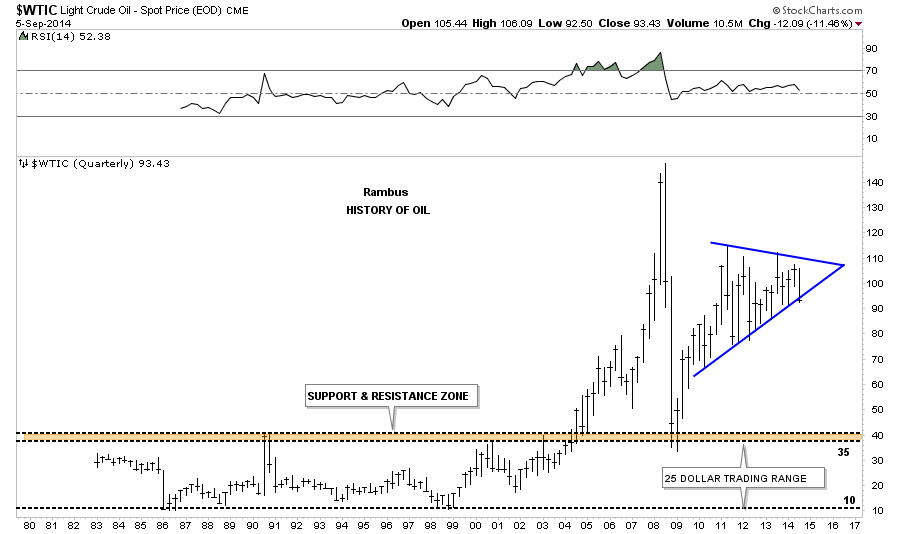
This last chart for Oil shows the entire history for this most important commodity. I’ll let the chart speak for itself.
There is one more important chart I would like to show you tonight that is the GASO, gasoline chart. Like so many of the other commodities 2011 marked an important high. GASO has been chopping out a horizontal trading range and is now trading back at the bottom area of the blue rectangle.
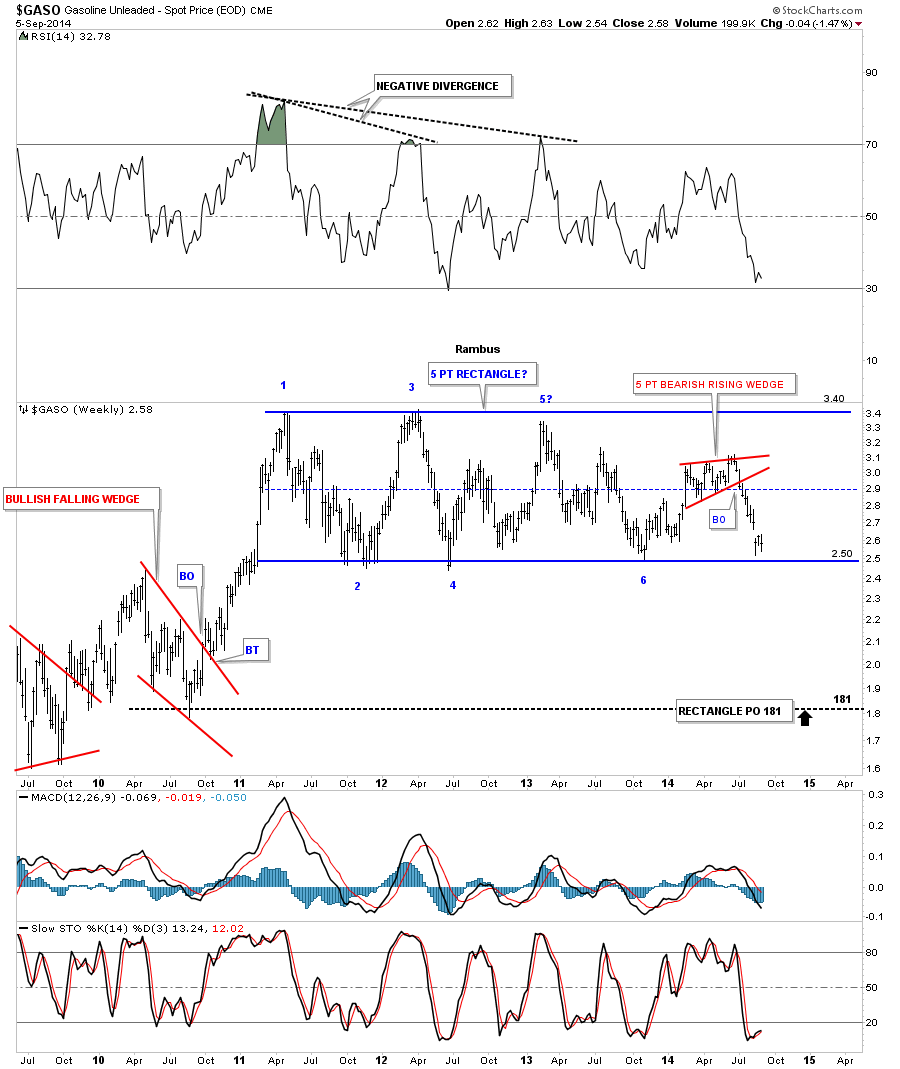
It would be hard to imagine gasoline trading down to the 1.80 area if the blue rectangle breaks down. The same goes for the Oil that would have a price objective down around the 78 area. With the US dollar showing some important strength and breaking out of a multi year base maybe these price objective are realistic. Until something alters these long term charts I have to put myself in the deflation camp and see how things play out over the next several years. Time always tells the story. All the best…Rambus