
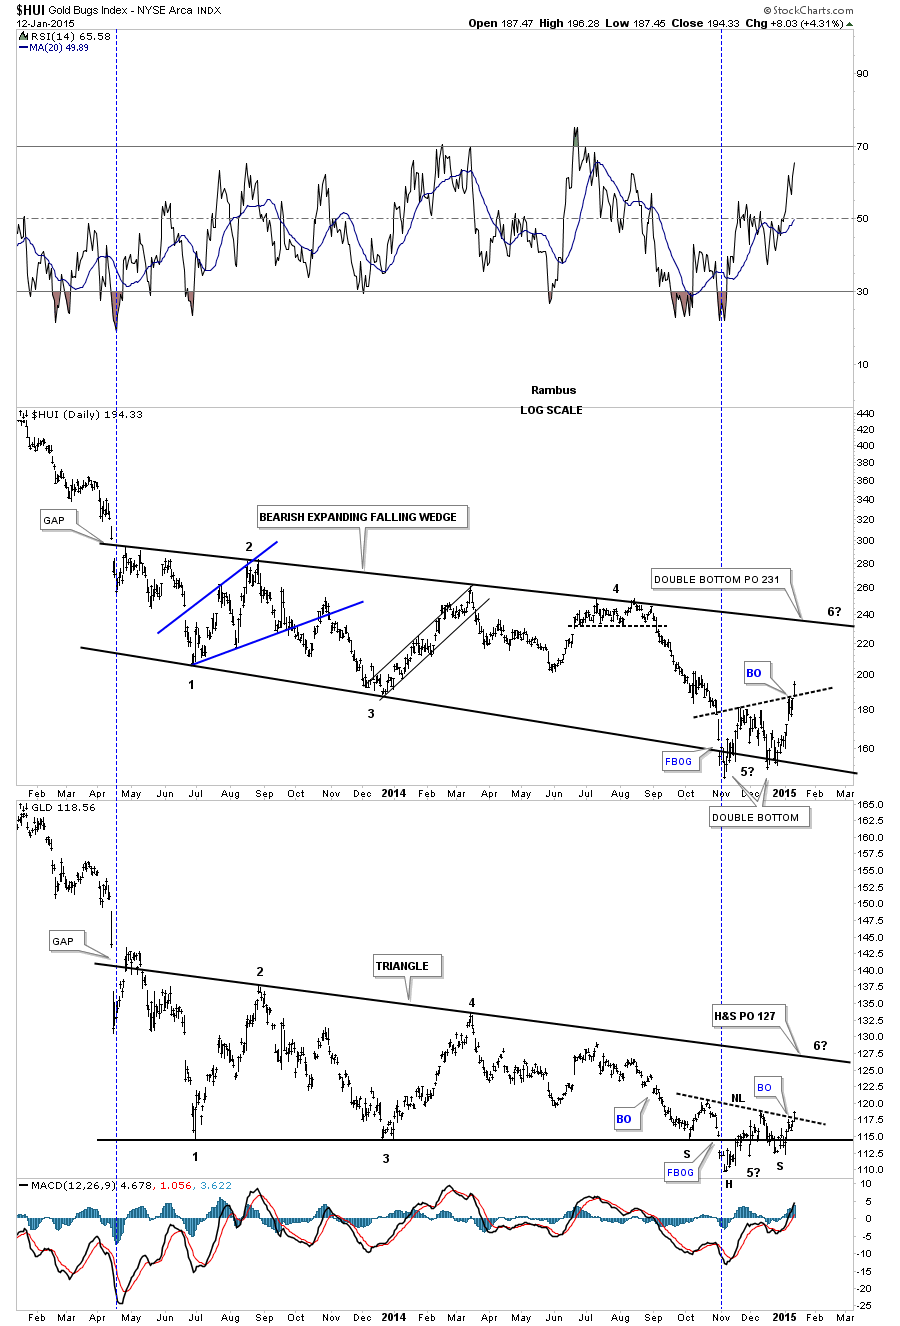
I believe today marked a breakout on the PM stock indexes and Gold which have different reversal patterns. Below is the combo chart we’ve been following that has the HUI on top and GLD on the bottom. As you can see the HUI broke above its double bottom trendline today while GLD broke above its neckline. Both reversal patterns have a price objective back up to the top rails of their 18 month consolidation patterns. I’m still viewing this rally off of the November low as a counter trend rally within the bear market. Instead of having just four reversal points it looks like we’ll see at least six to complete their respective consolidation patterns. A serious break above the top rail of the 18 month consolidation would then call into question the validity of the bear market.
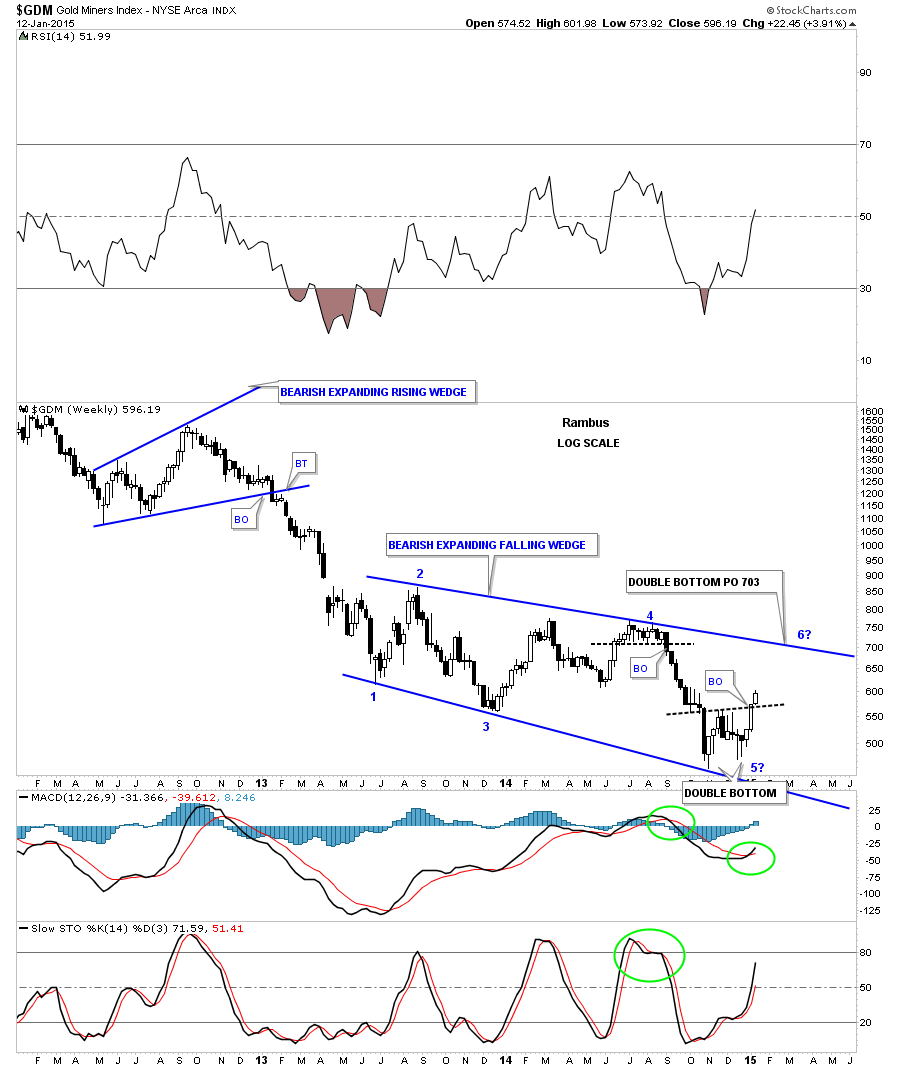
Below is a weekly chart for GDM that shows its 18 month blue bearish expanding falling wedge. The double bottom has a price objective up to the 700 area which coincides with the top rail. Our line in the sand is now the double bottom trendline. Above is bullish and below is bearish. Note the price action at reversal point #4. If you recall we went short on the breakout of that black dashed horizontal trendline using JDST and DUST. You can see the string of black candles that accompanied that decline. This week is just getting started but we have two white candles in place so far.
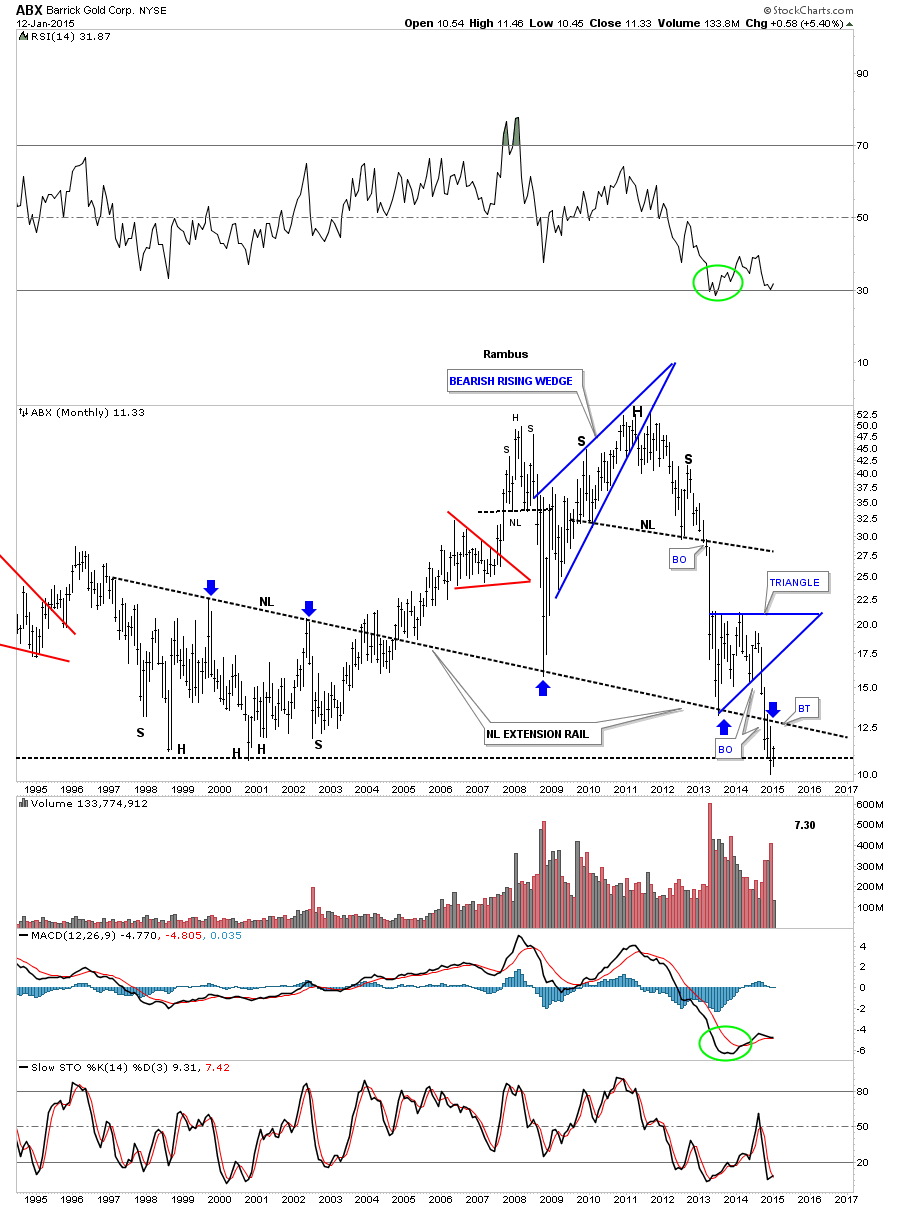
Lets now look under the Hood to see what is running these indexes starting with one of the big ones ABX. The monthly chart shows where the neckline extension rail may come into play if we get this counter trend rally to the upside.
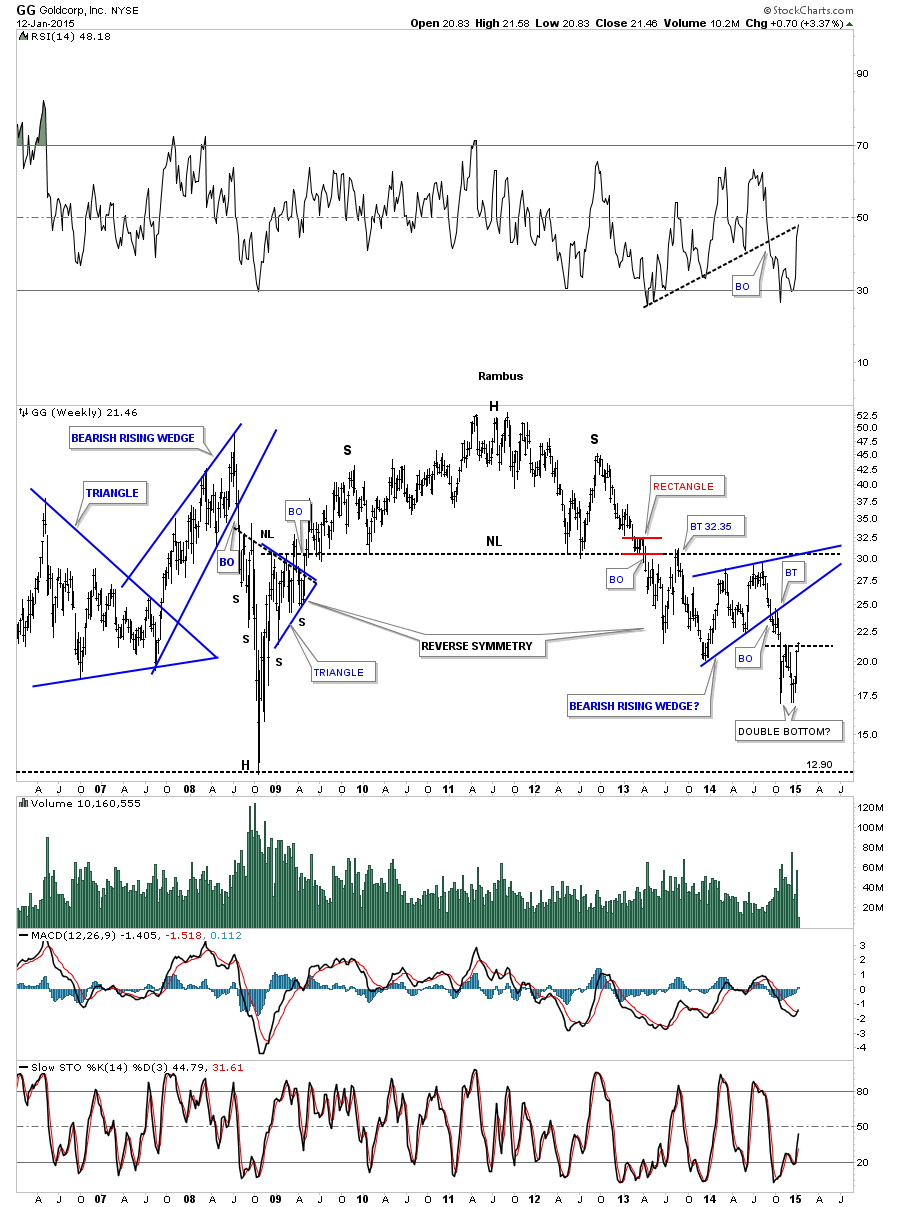
The weekly chart for GG shows it trying to breakout from a small double bottom. It could backtest the bottom rail of the blue bearish rising wedge again.
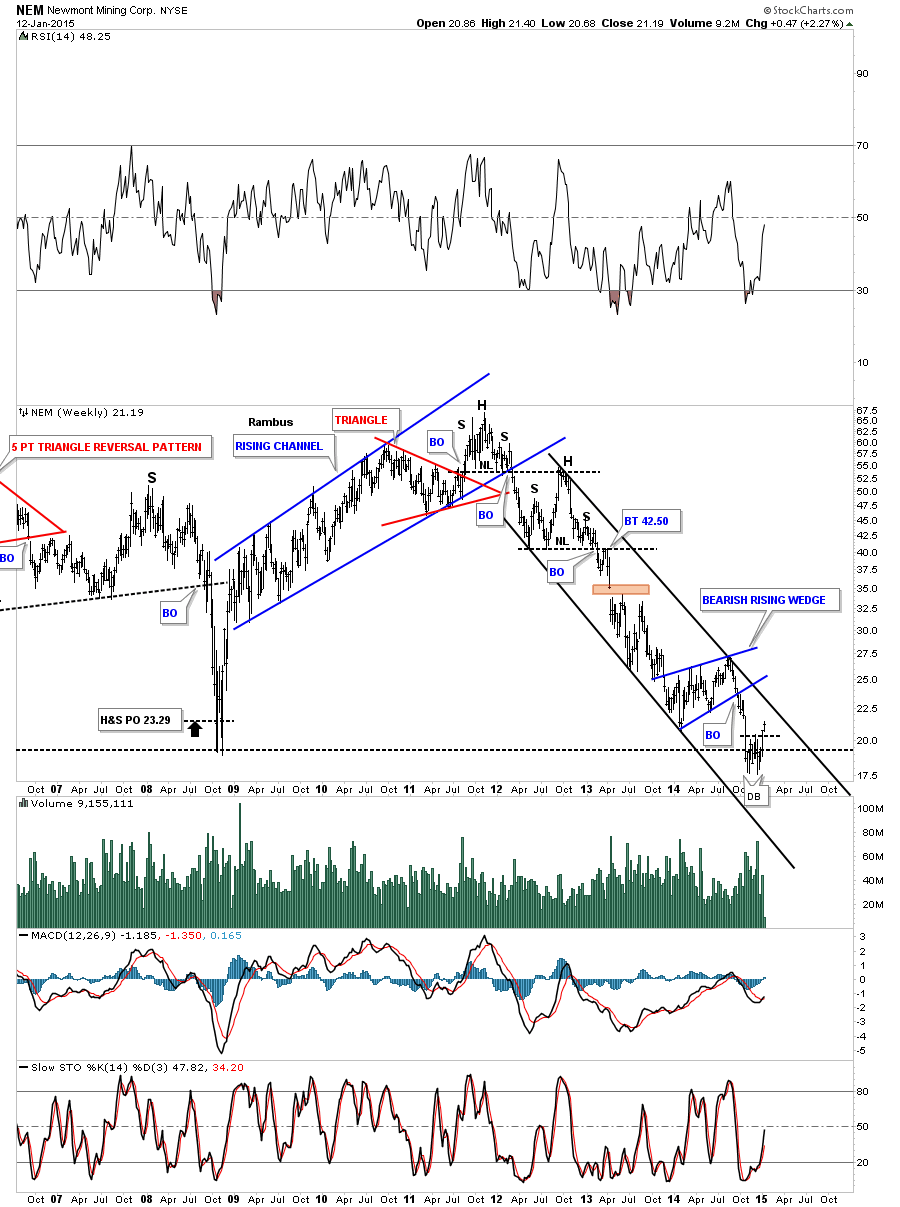
NEM is another big cap PM stocks that is breaking out above a small double bottom.
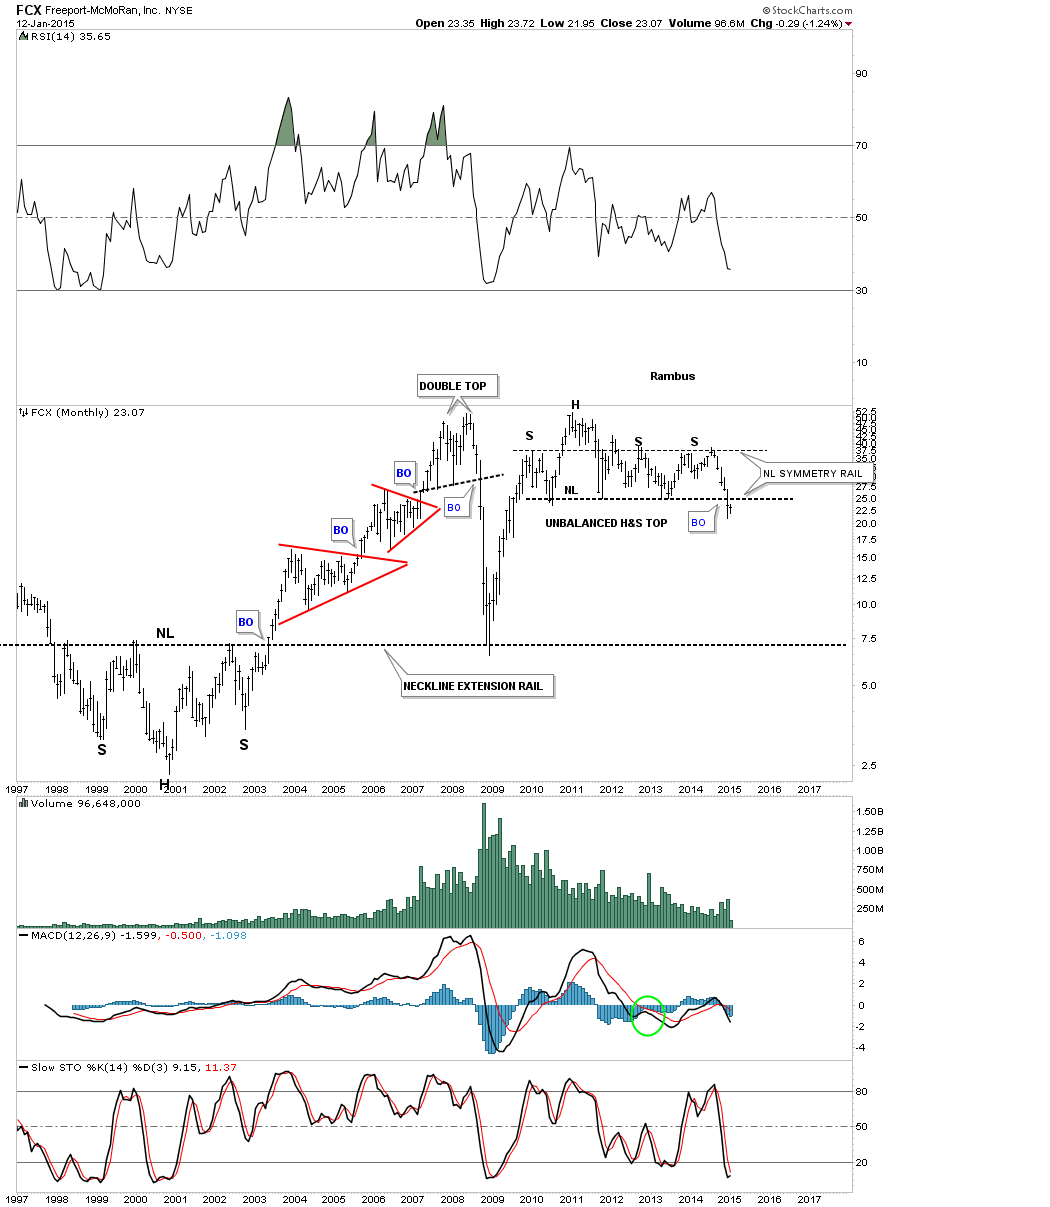
It looks like FCX is in the process of backtesting the neckline from an unbalanced H&S top.
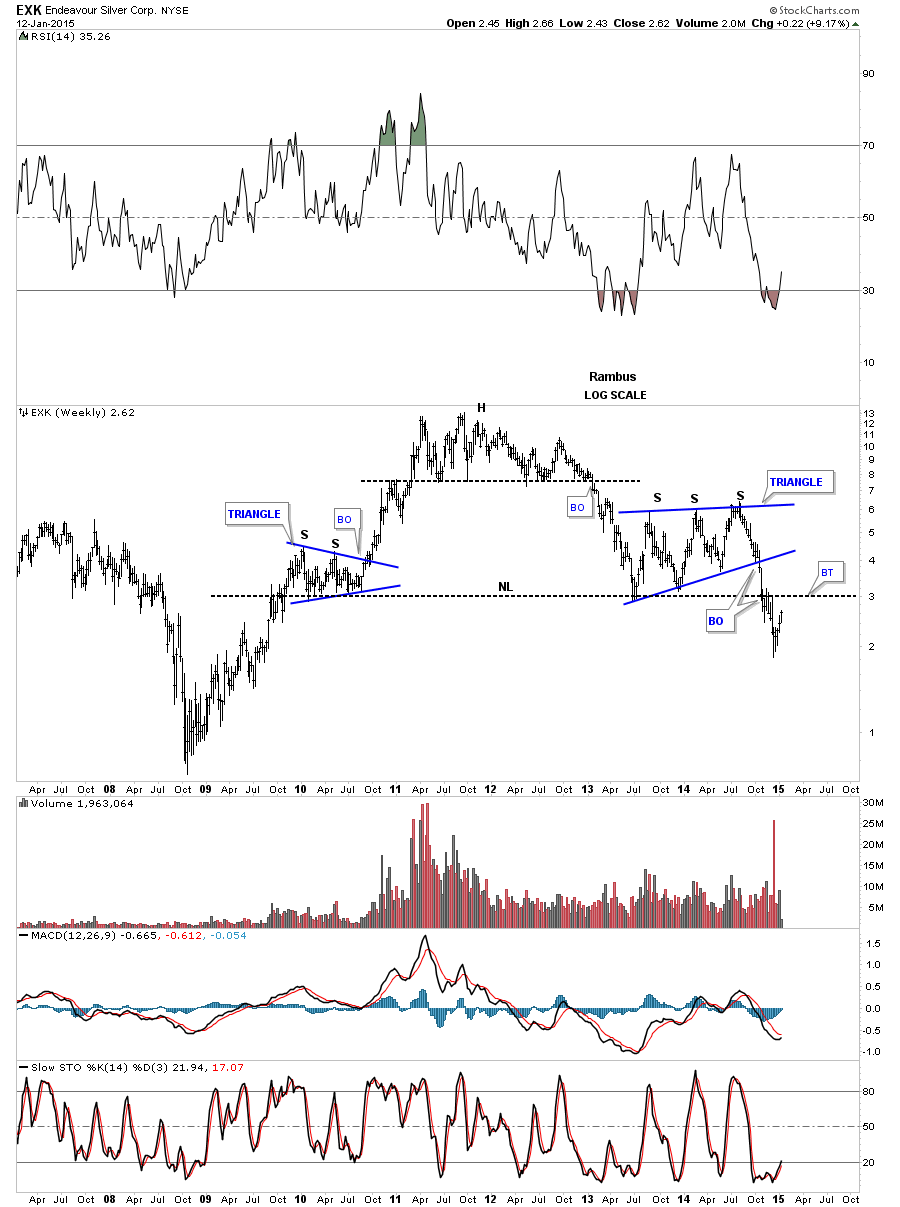
EXK looks like it to is in the process of backtesting its potential multi year neckline.
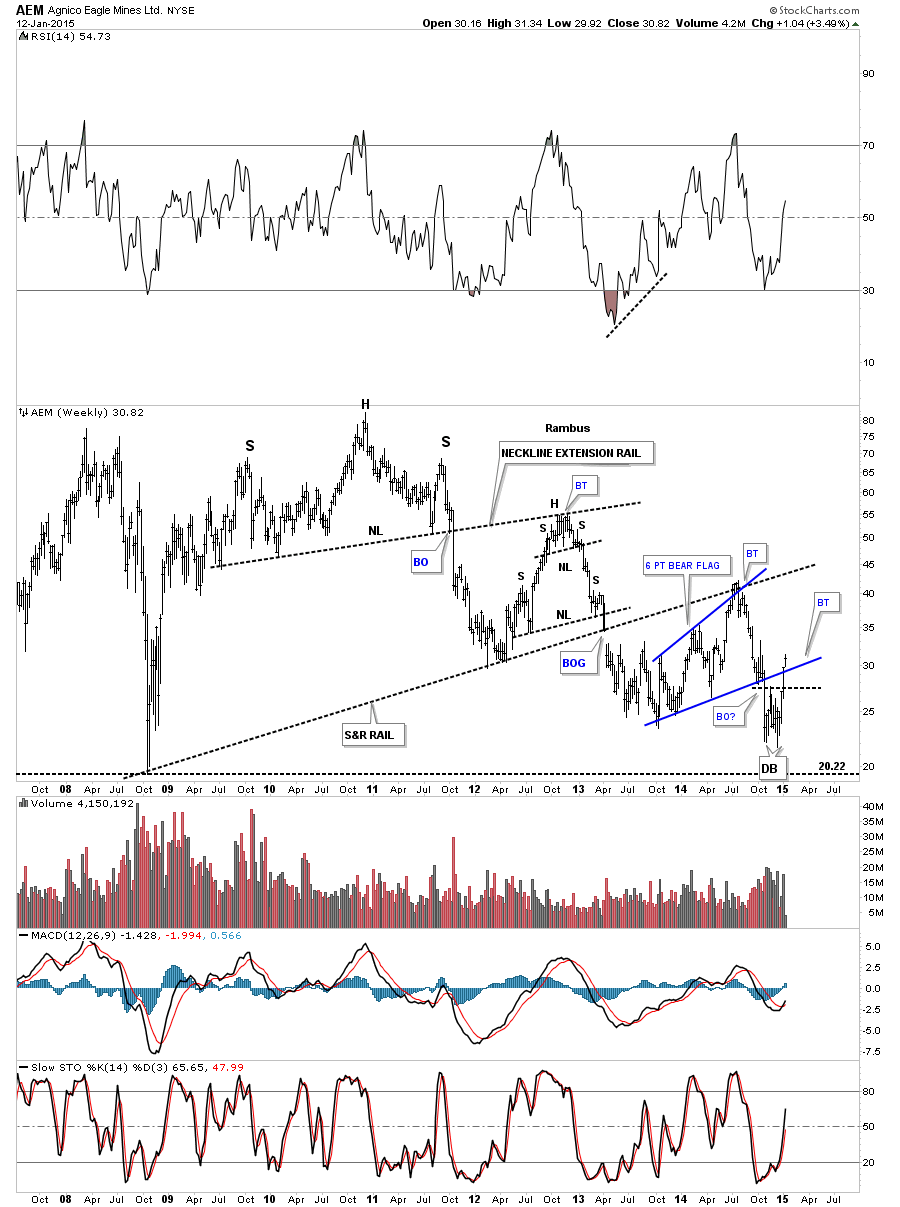
AEM is showing some strength after breaking out from its double bottom and is now breaking above the bottom blue rail of a 6 point expanding bear flag.
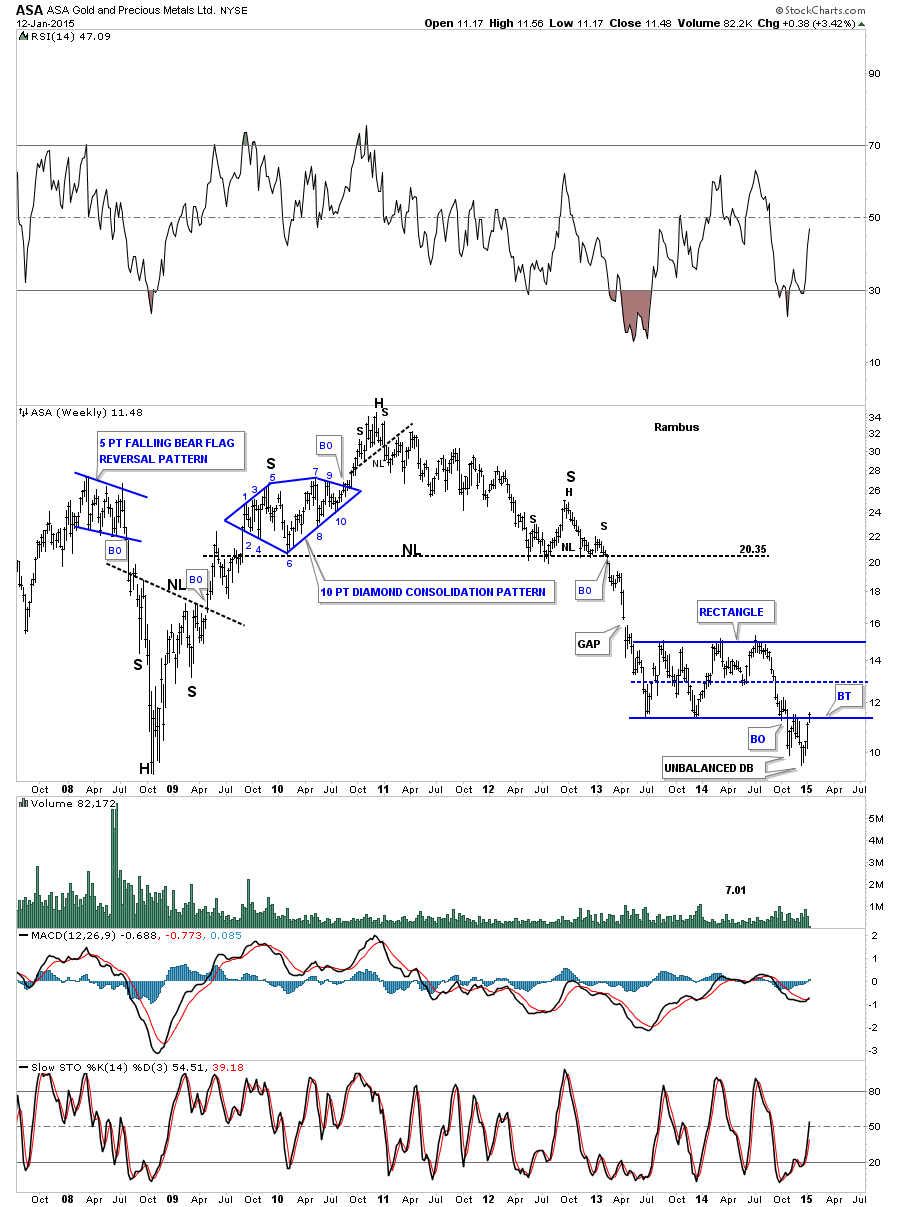
ASA is showing some strength by closing back above the bottom rail of a well defined rectangle.
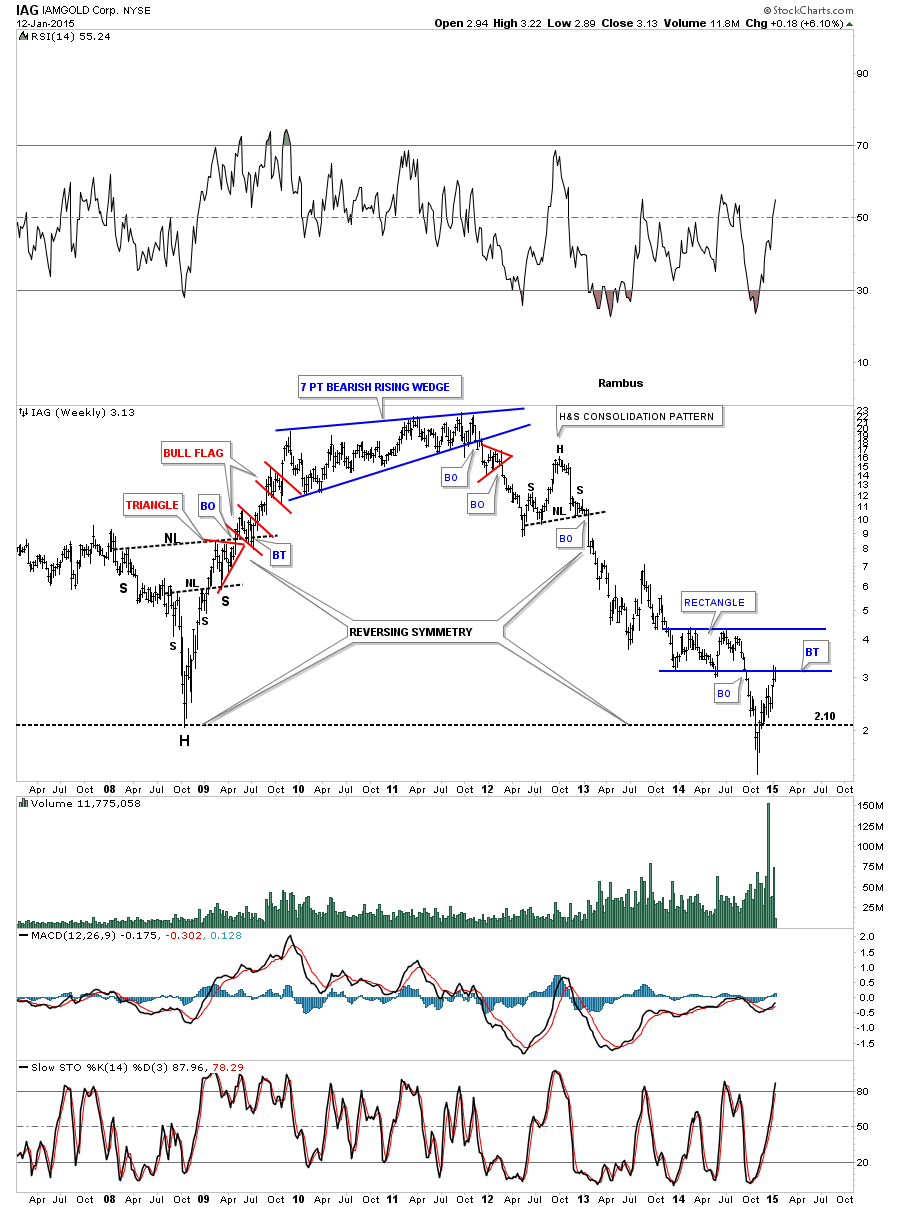
IAG hit the bottom rail of its blue rectangle but sold off on the initial hit. One to keep an eye on.
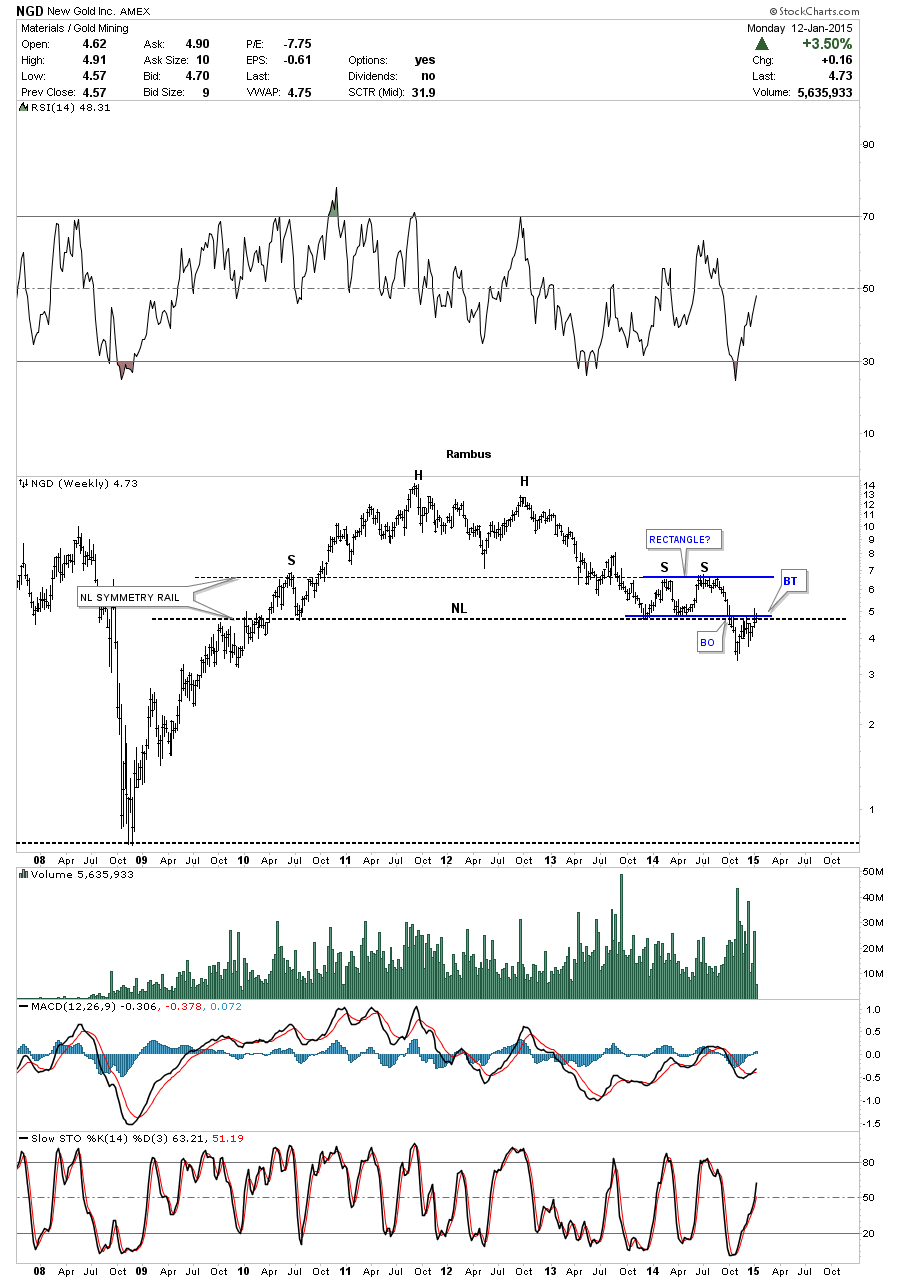
NGD is attempting to backtest its multi year neckline.
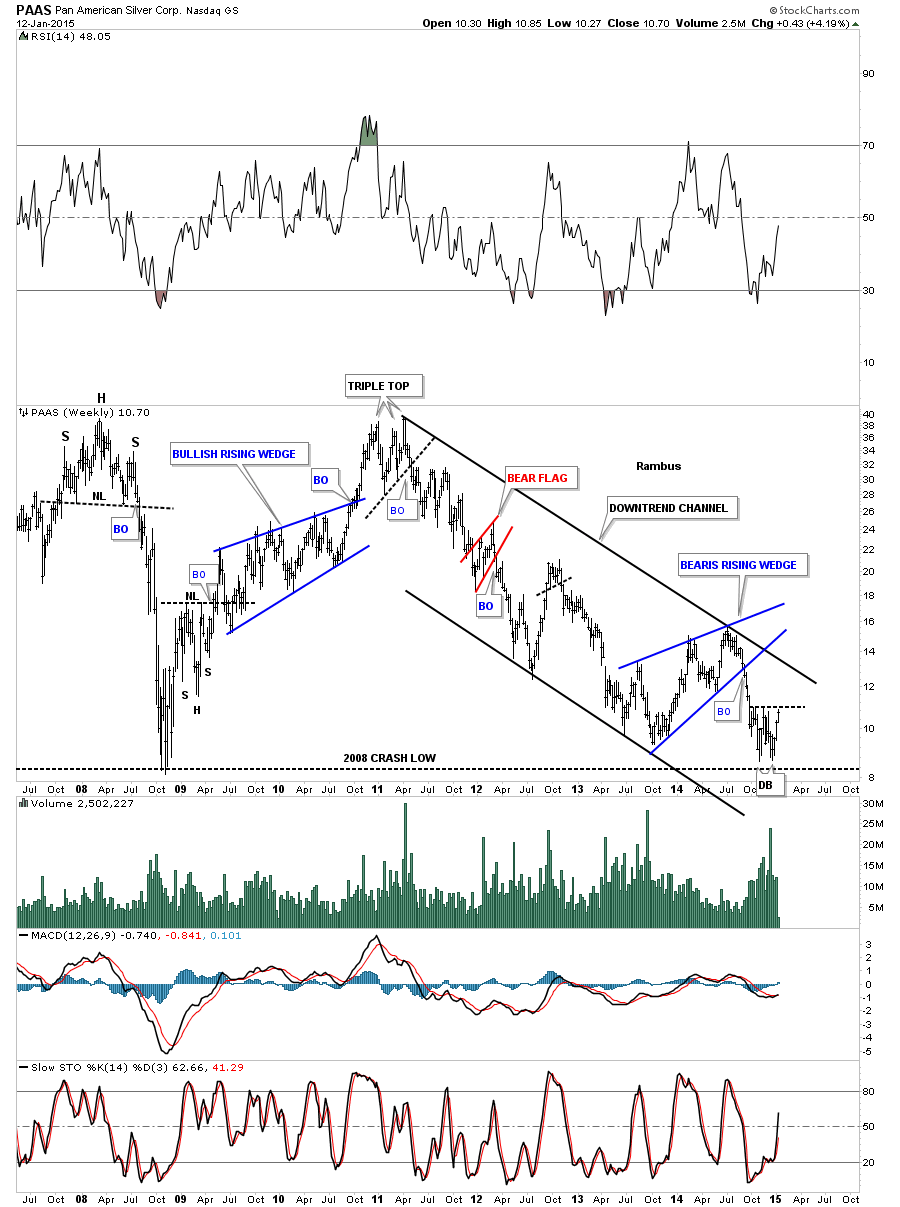
PAAS is showing a potential small double bottom within the major downtrend channel.
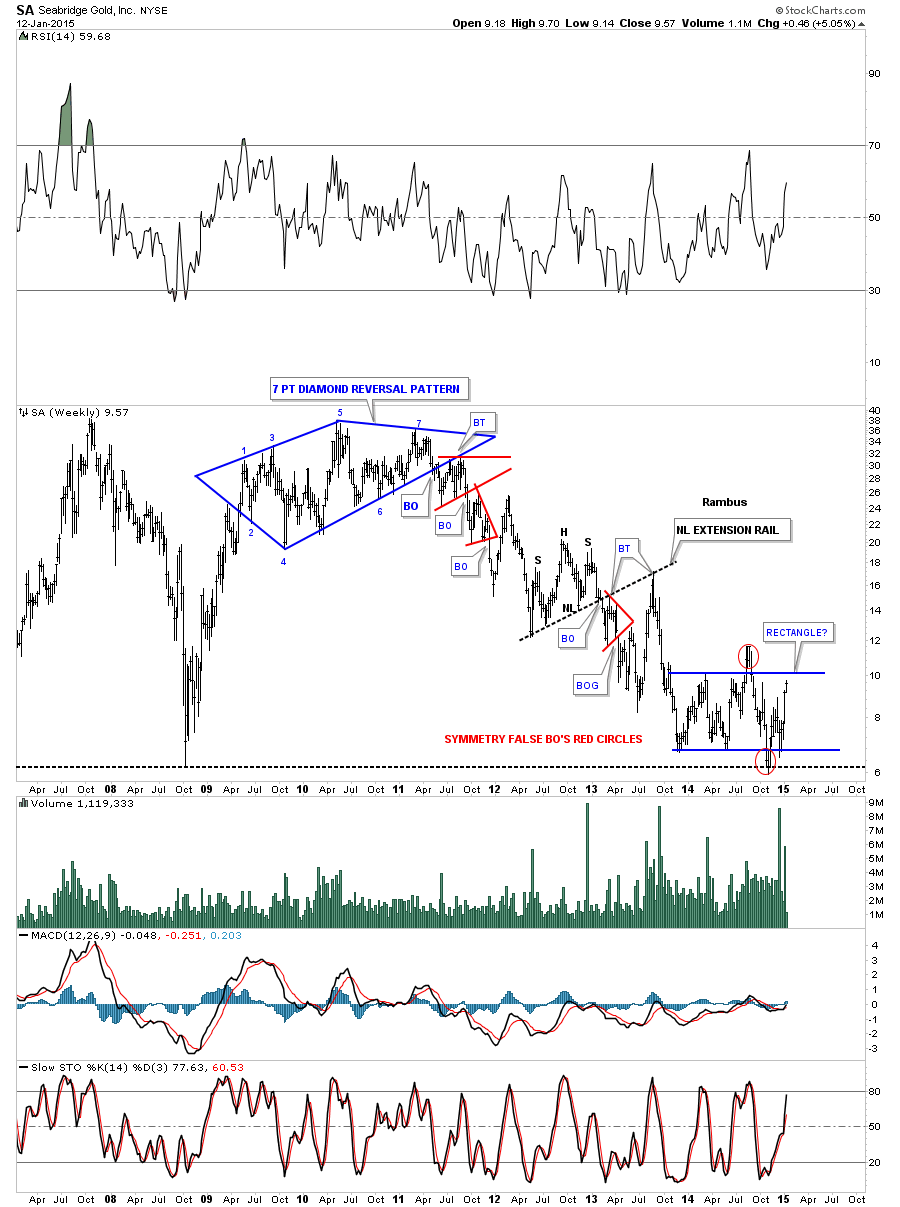
SA is still chopping around in a big one year loose rectangle.
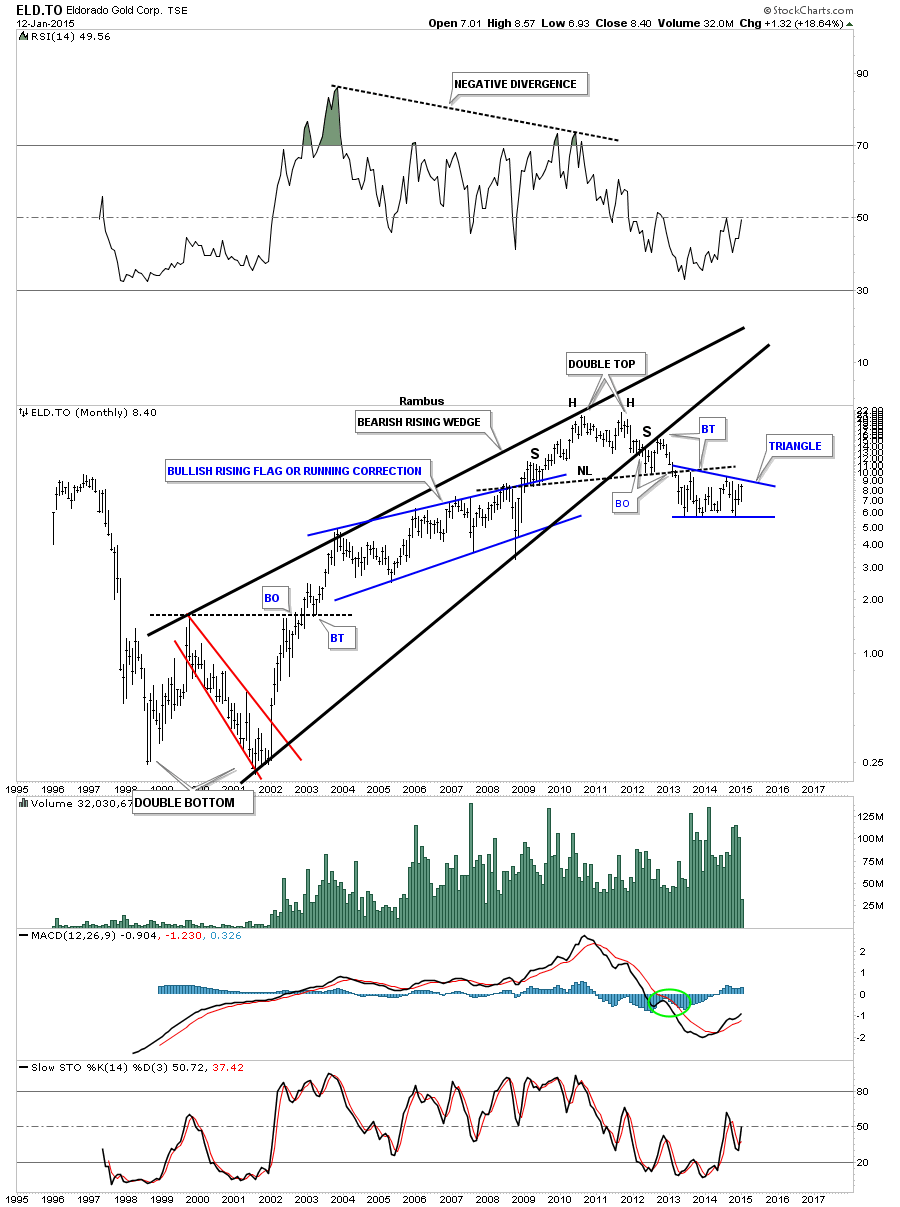
ELD.TO is trading inside the blue triangle which is located just below the big neckline.
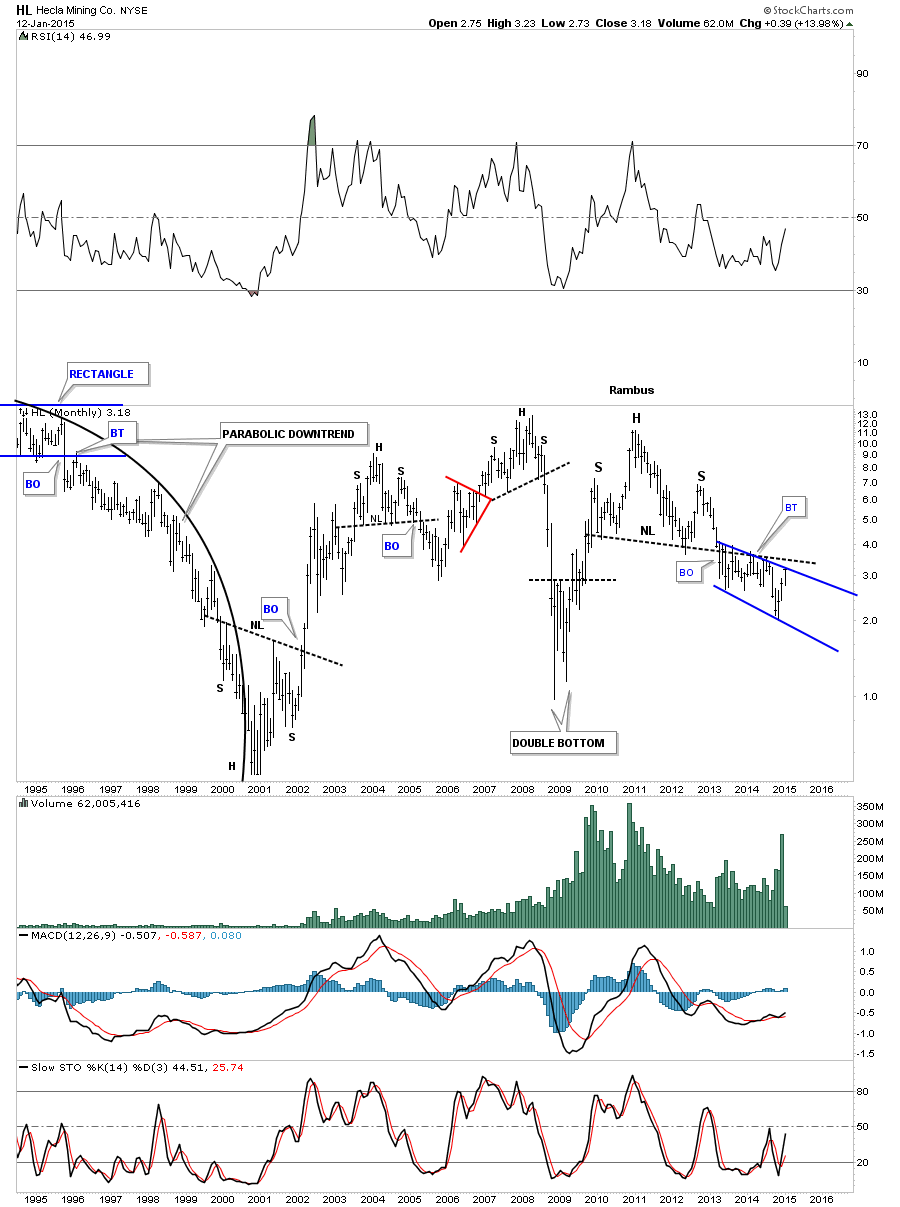
HL is still chopping around below its big H&S neckline.
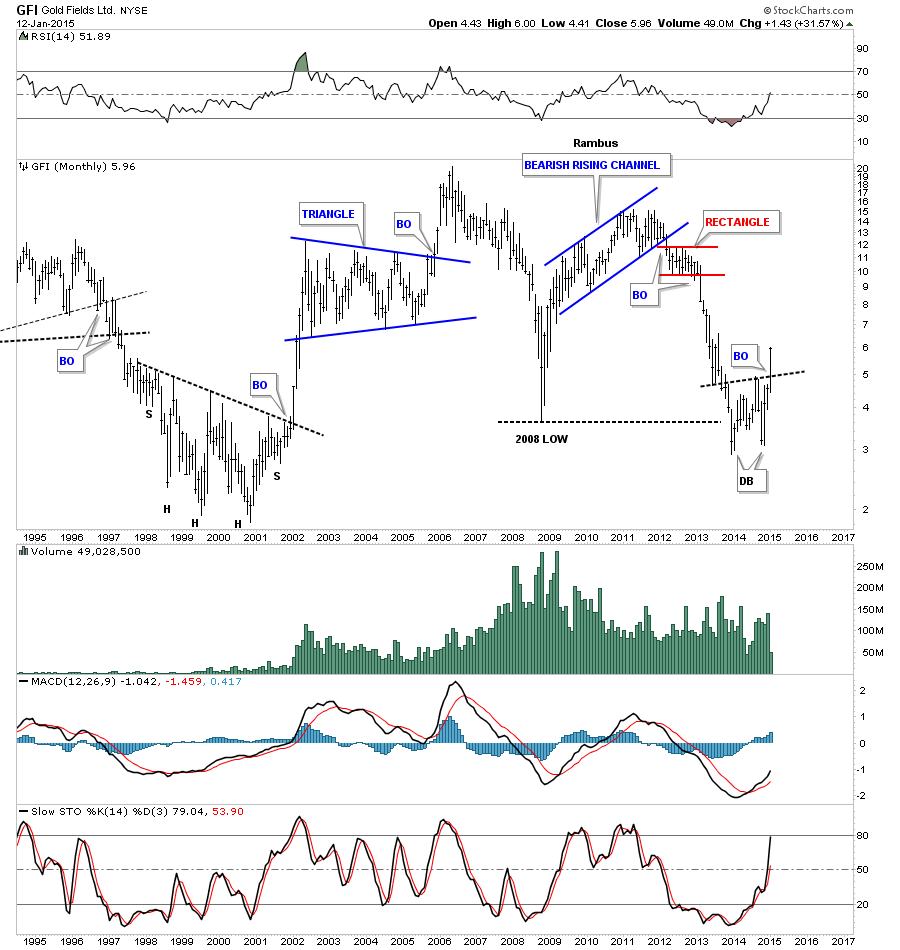
GFI is showing some relative strength by breaking above its double bottom trendline.
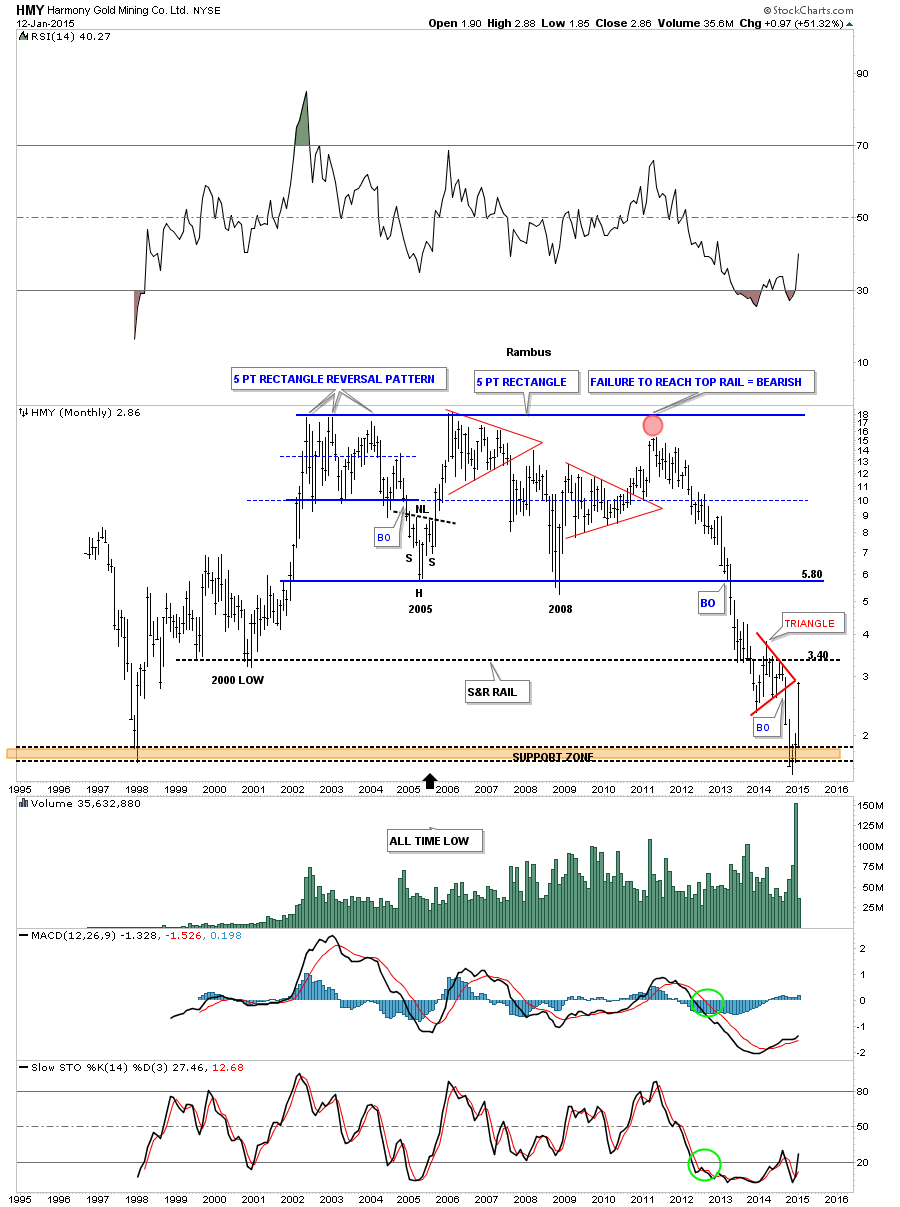
HMY is another South African producer that is looking strong on a relative basis.
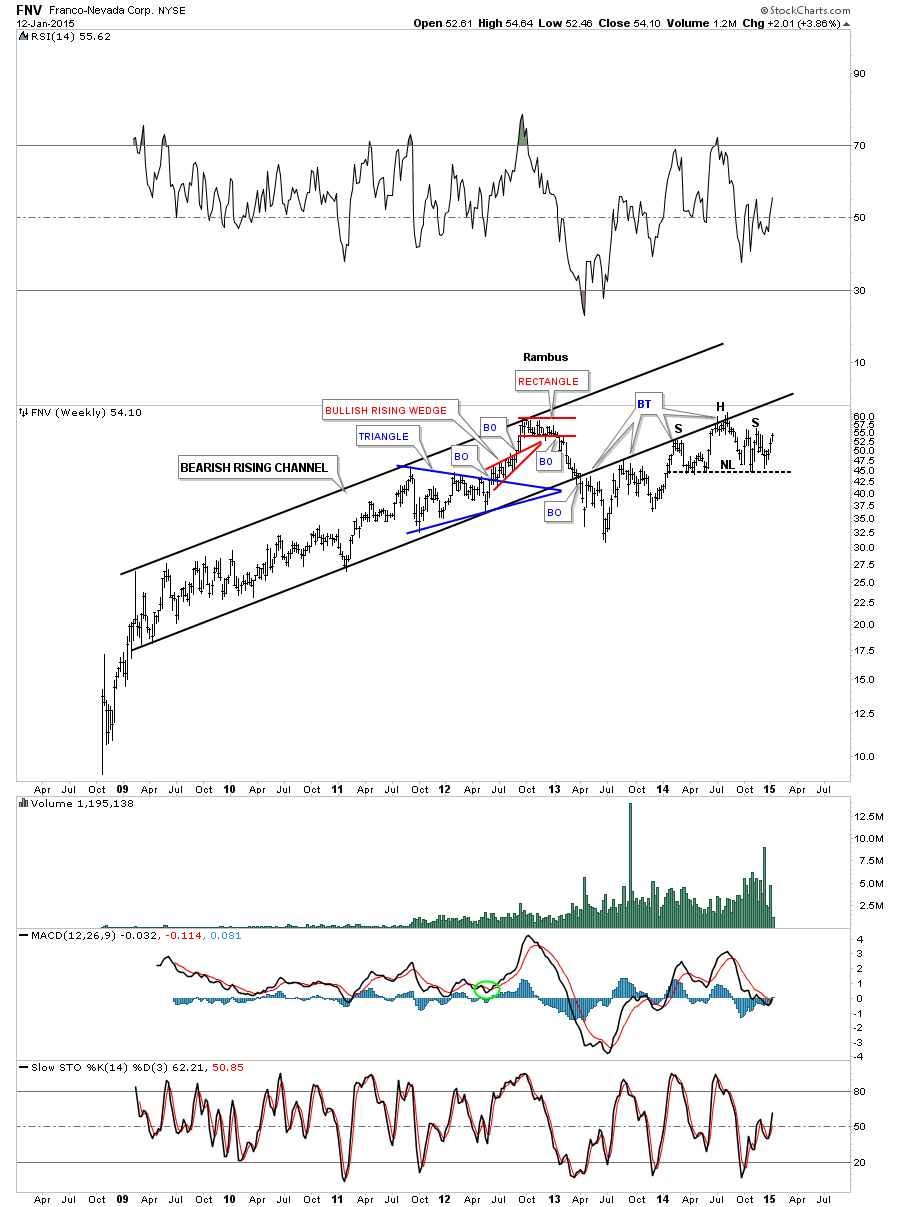
FNV is still trading below the bottom rail of the huge rising channel. Maybe it will backtest the bottom black rail again for the 5th time if the PM stock remain buoyant.
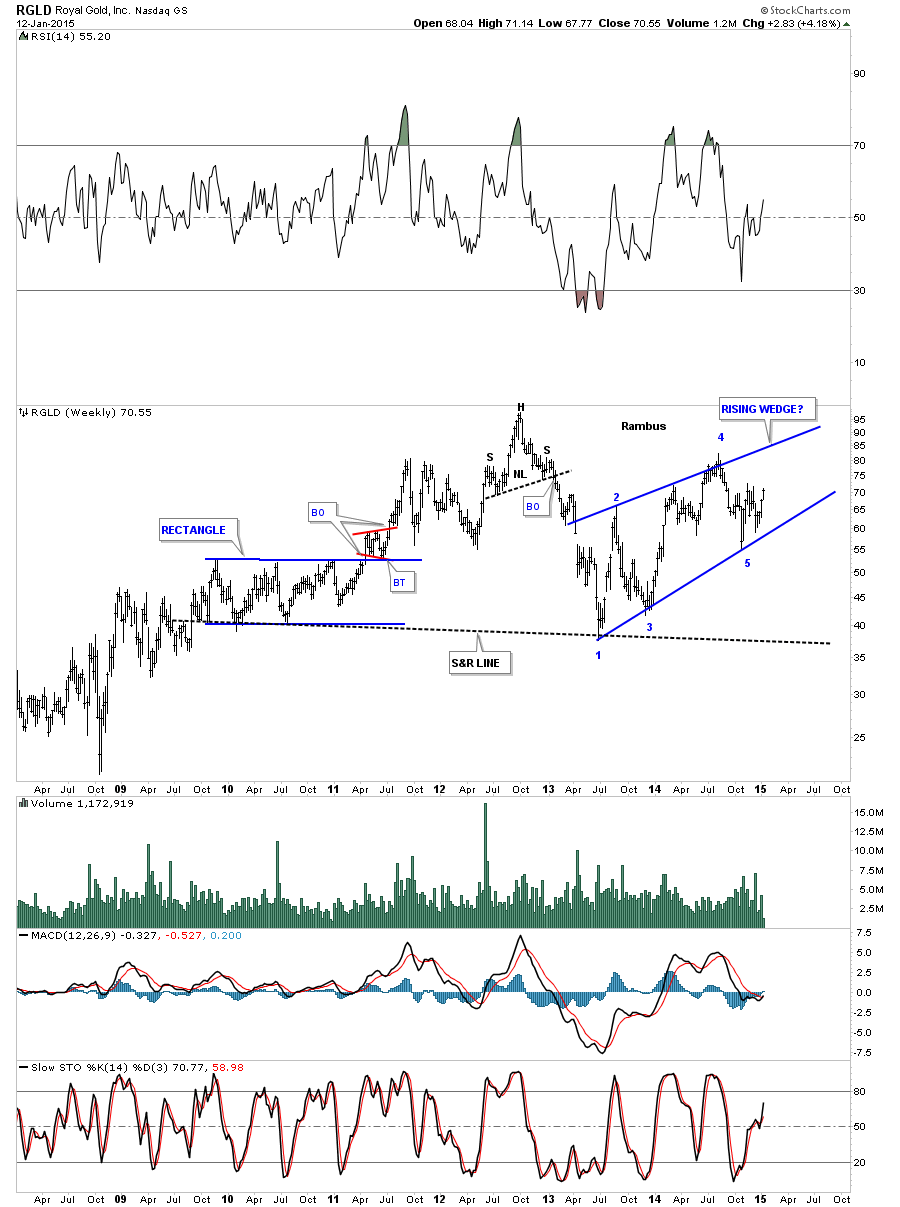
RGLD is still chopping around inside a rising wedge creating a possible 5th reversal point.
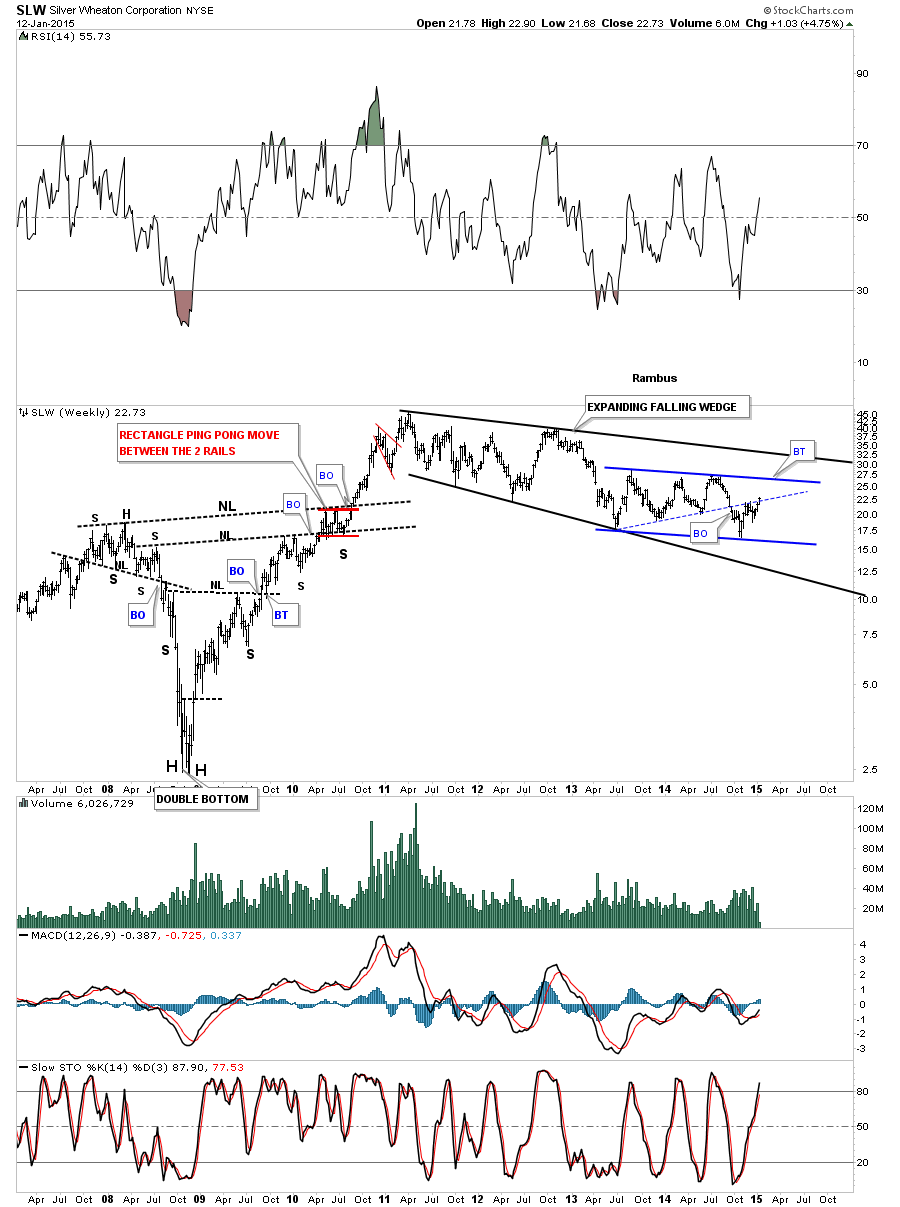
SLW is trading back inside the blue triangle which is part of a bigger consolidation pattern an expanding falling wedge.
I’ll keep a close eye on these stocks and others for clues to see how high they may move. Right now it’s still a mixed bag with some looking more bullish than others. The top rail of the expanding falling wedge, on the GDM chart above, will tell the tale if or when we get there. All the best…Rambus