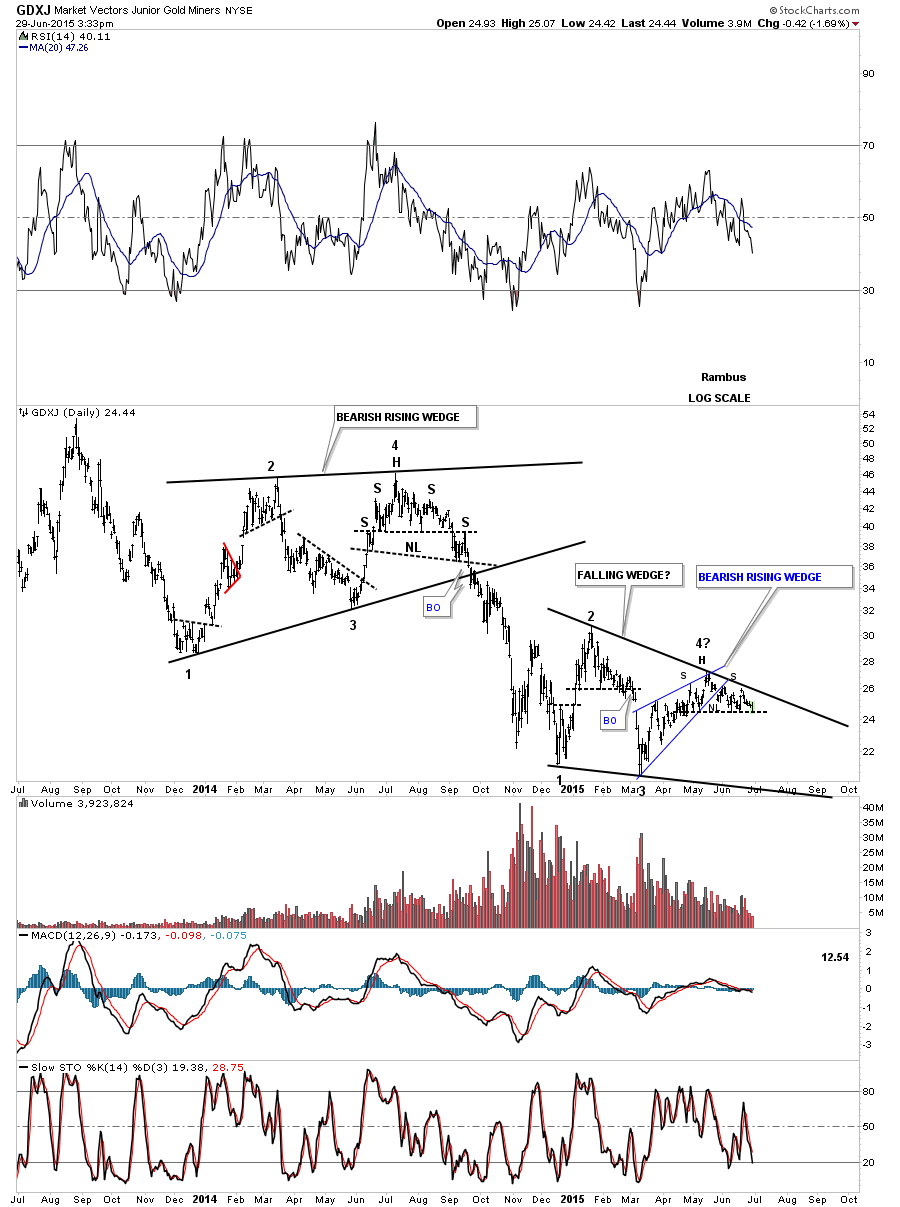
The GDXJ is at an important inflection point right here and now. As you can see it’s sitting right on the neckline of a small H&S top that has formed at the fourth reversal point on the potential bearish falling wedge. A break of the neckline will almost assure a move down to the bottom blue rail of the falling wedge at a minimum.
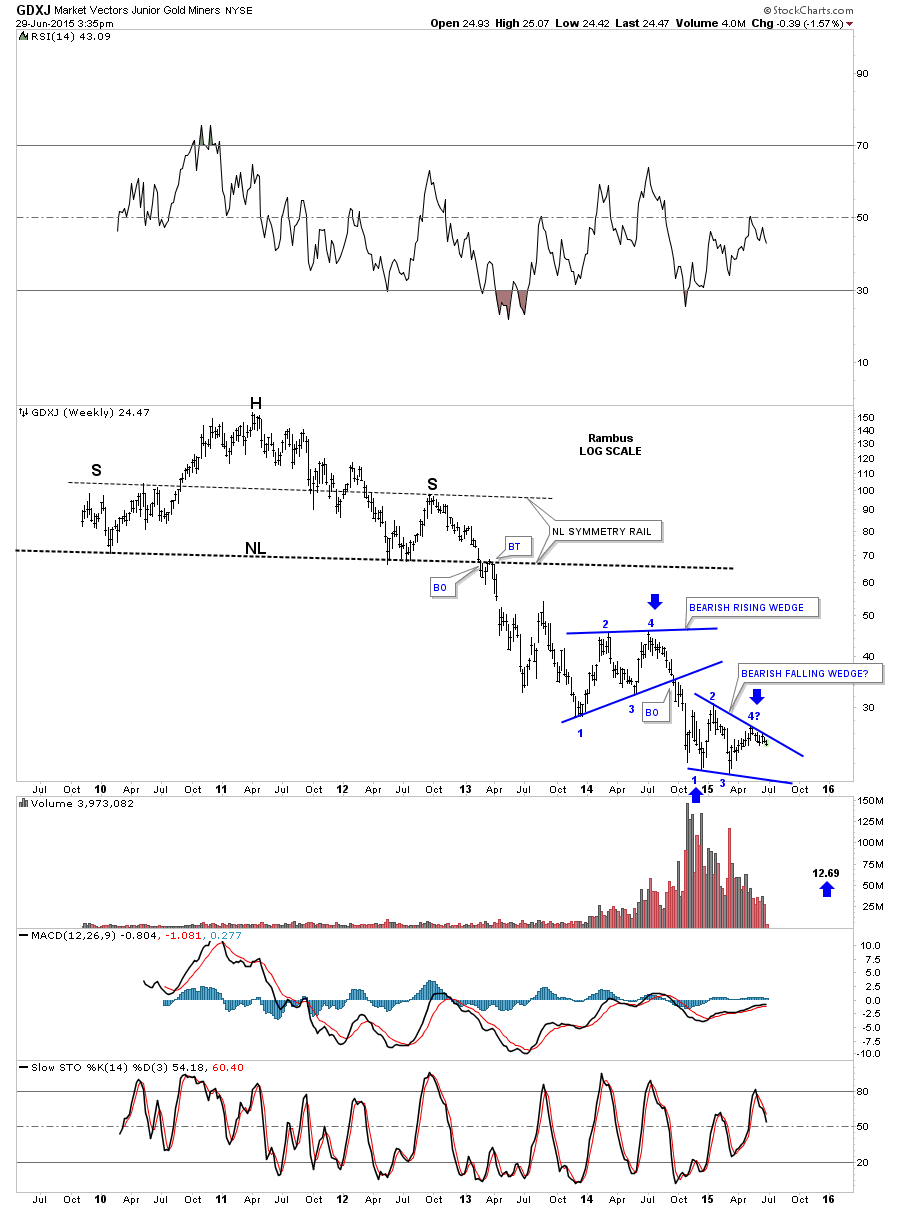
The long term weekly chart shows the two blue consolidation patterns with the lower one being the possible bearish falling wedge we looked at on the chart above. Note the 4th reversal point in the top pattern, the bearish rising wedge, and the decline that followed. The fourth reversal point in the lower bearish falling wedge may very well be the beginning of the next impulse move down similar to the fourth reversal point in the bearish rising wedge. If that is true this move down is just getting started. The blue arrows measures the price objective down to the 12.69 area which would cut the GDXJ in half from the current level.
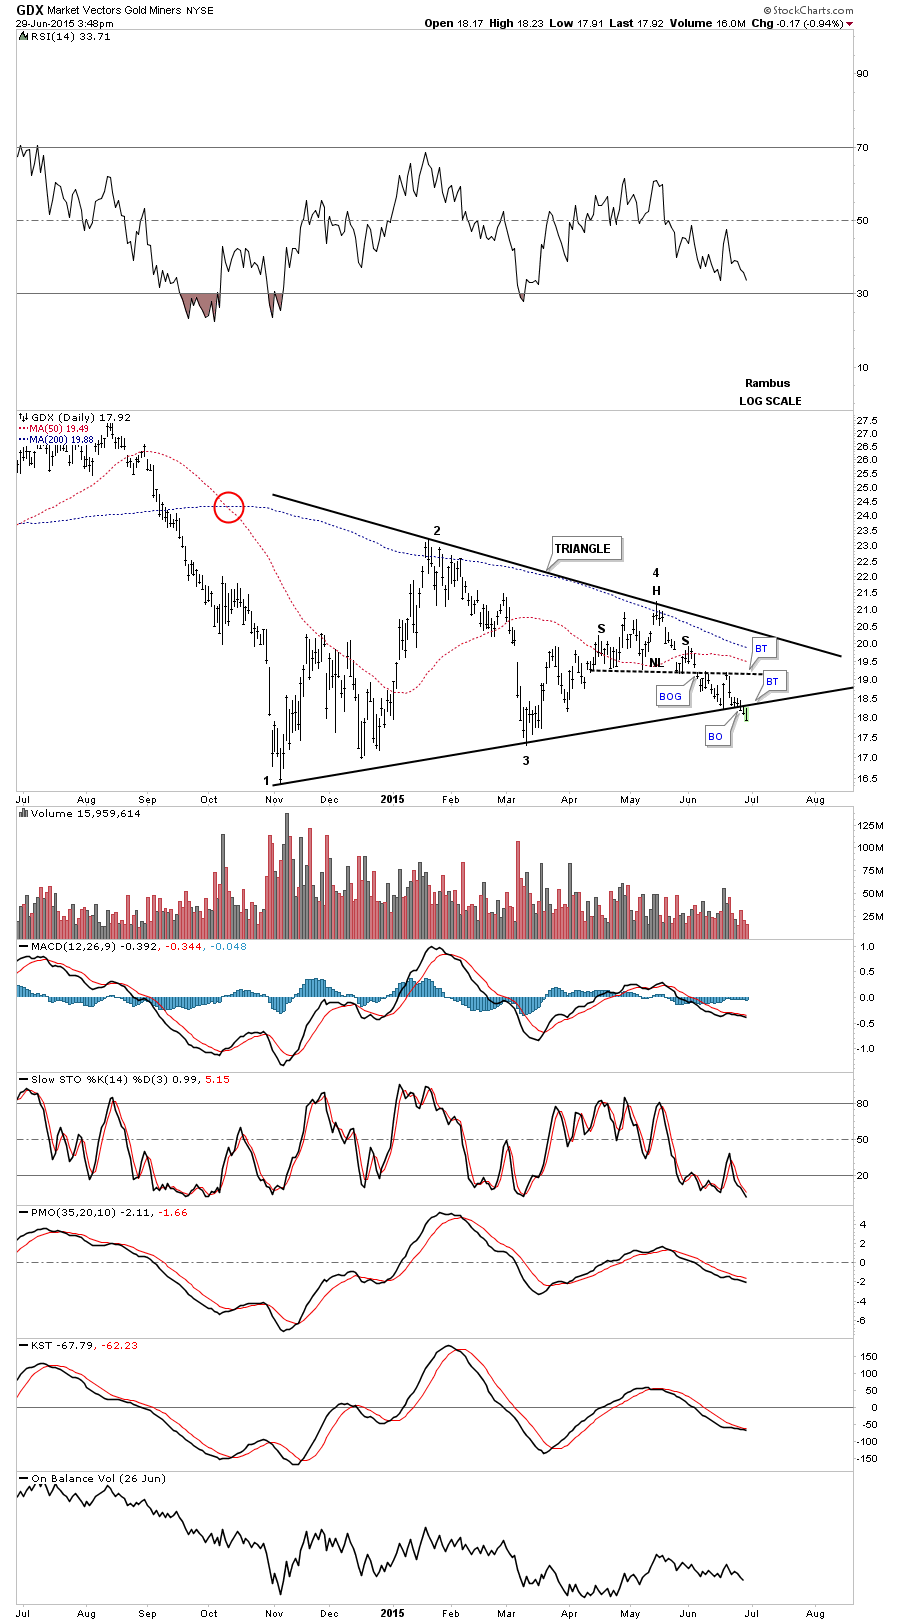
The daily chart for the GDX shows it has now broken below the bottom rail of the black triangle using the bar chart. Notice it formed a small H&S top at its fourth reversal point similar to what the GDXJ is doing right now. When you compare this daily chart for the GDX to the GDXJ chart above the GDX big caps are leading the way lower. Maybe the small caps will play catch up as they are lower on a percentage basis today.