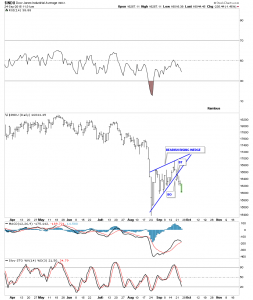
The small trading range since the August low was kind of sloppy in its development but the true picture has emerged. Last Friday it cracked the bottom rail of a bearish rising wedge with the backtest this past Monday. The INDU is now in its third day of its new impulse move down. At this point in time the price objective for a falling wedge is to where it began to form which would be the August low. On the other hand it could also be a halfway pattern which would show up between the two impulse moves. The first impulse move led into the bottom of the bearish rising wedge and the second impulse move would be measured from the last reversal point in the blue bearish rising wedge. The August low is going to be very important for several reasons. If it continues to hold support that would nullify a potential big H&S top. If it gives way then the new bear market will be born.
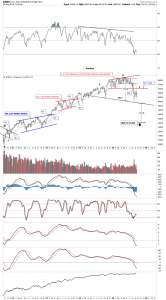
The weekly chart below shows the potential H&S top and the initial price objective if the neckline gives way.
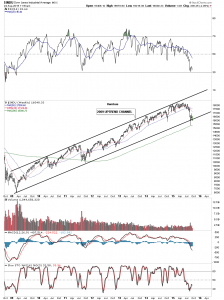
Another long term weekly chart for the INDU shows its uptrend channel that began to form at the 2009 crash low. As you can see the August low broke the bottom rail but found support at the 200 week moving average which is around the 15,380 area. A lot of important long terms trendlines are being tested.


