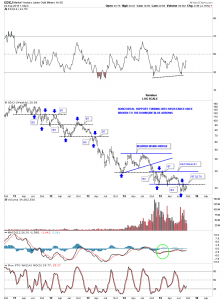
Below is a weekly chart that shows how horizontal support reverses its role and turns into resistance once it’s broken to the downside as shown by the horizontal black dashed lines and blue arrows. The horizontal S&R line at the bottom of the chart shows the 22.70 area has been tested several times so far. Since the 2011 top you can see a series of lower highs and lower lows through out this bear market. The first really bullish setup would be if the GDXJ could close above the 29.50 area.
Rambus Chartology
Moving forward

