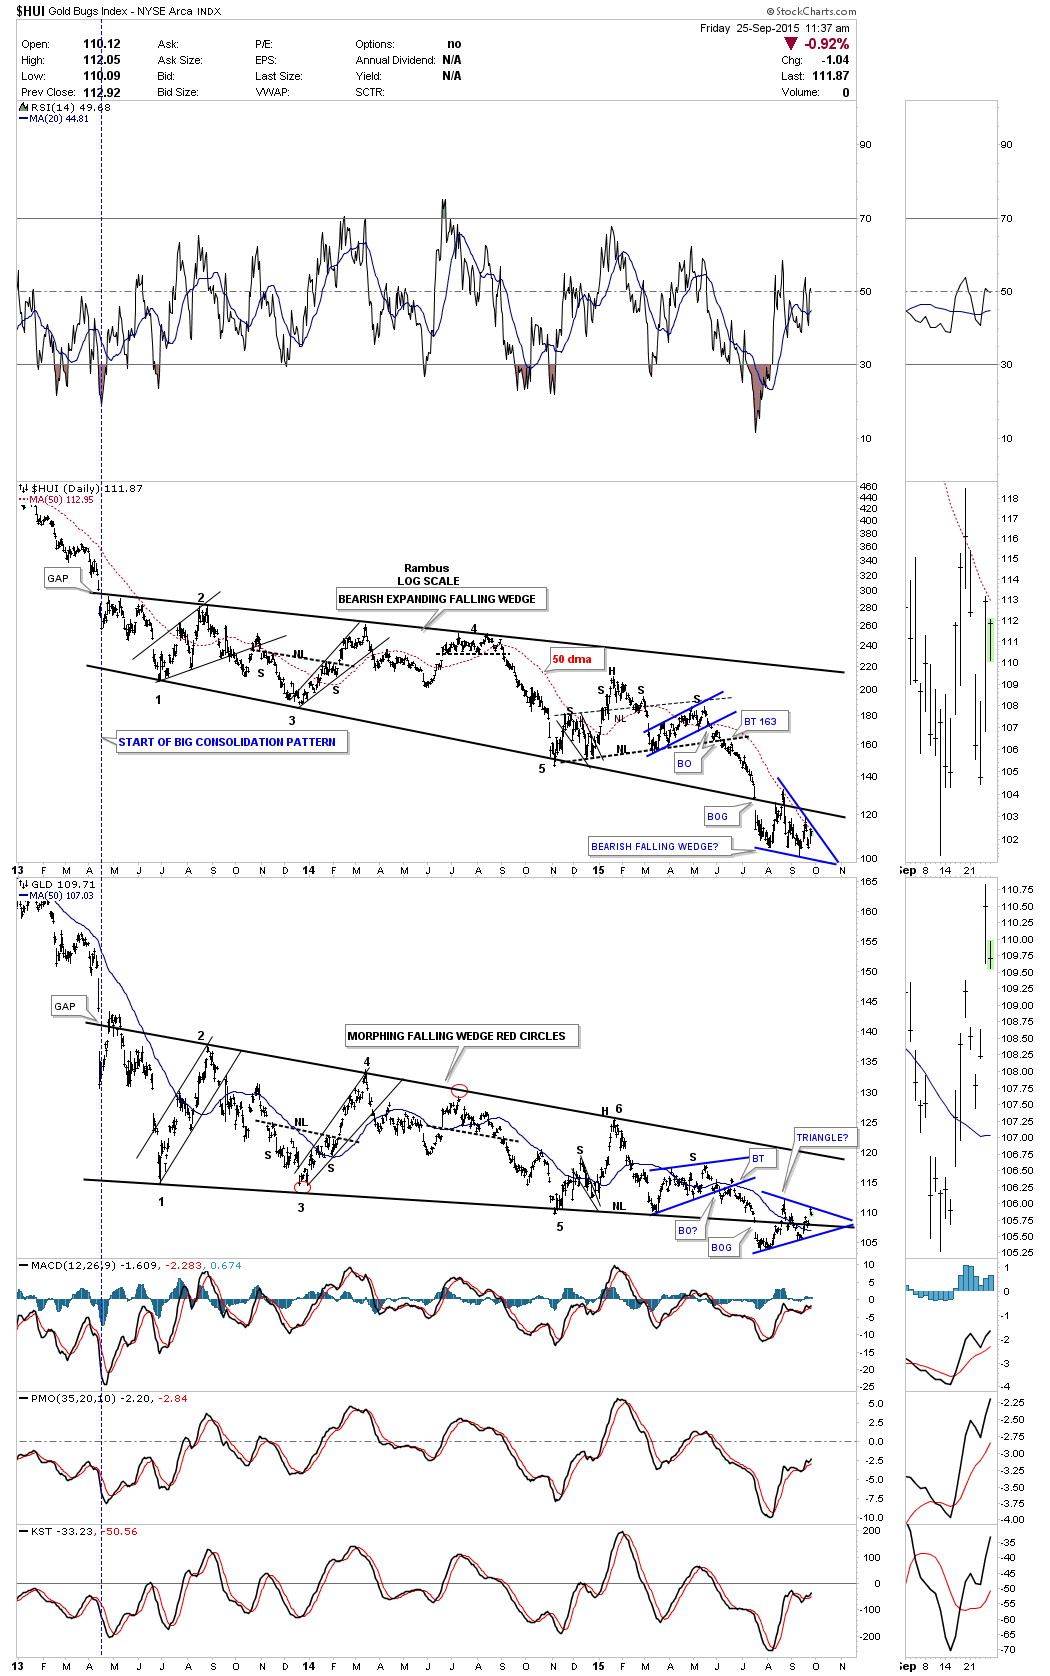
Below is the long term combo chart we’ve been following for a very long time now. Longer term member will remember the bottom rails of both of the 2 1/2 year consolidation patterns that seemed like they would never give way. Finally in July of this year they both simultaneously gapped below the bottom rail of their respective trendlines. Since the big breakout gap both have been building out a small consolidation pattern with HUI building out its possible bearish falling mostly below the bottom rail. Gold on the other hand is building out its small consolidation pattern right on the bottom rail of its bearish falling wedge. Keep in mind both of these small blue consolidation patterns are not complete yet and won’t be until they break below their bottom trendlines. The fourth reversal point is always the hardest to spot in real time. It’s only after the fact that it will stick out like a sore thumb. Note how the 50 dma and the top rail of the HUI’s possible bearish falling wedge are parallel to each other.