
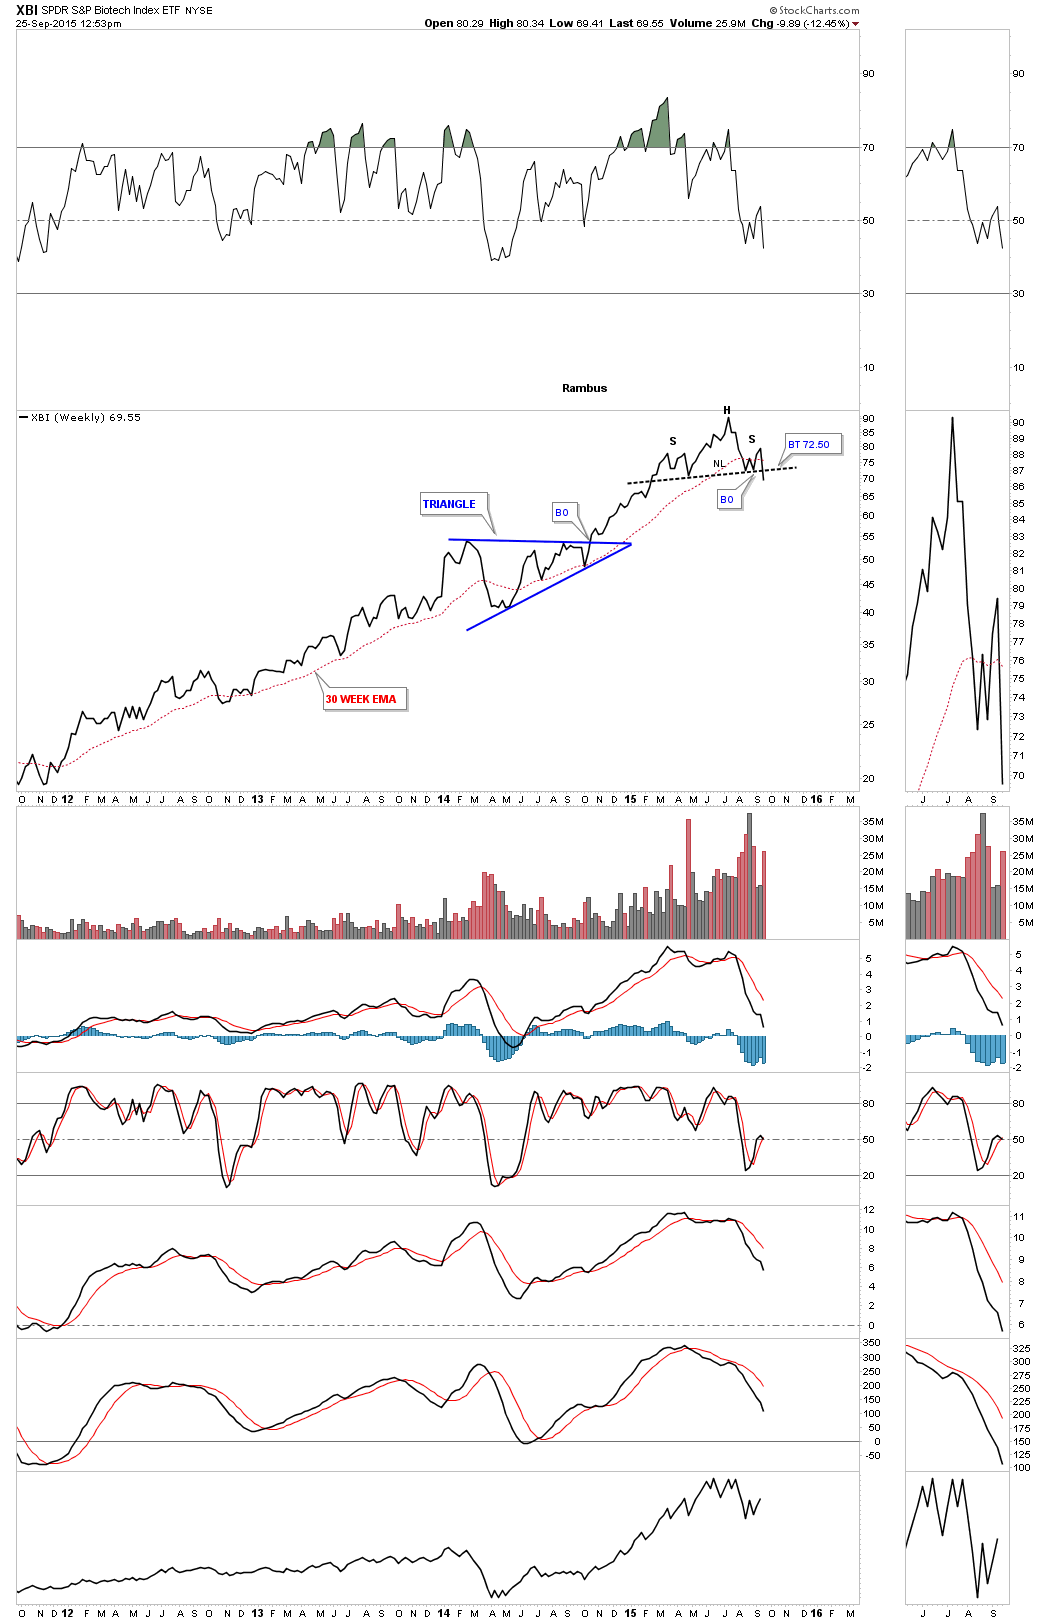
The long term weekly line chart for the XBI, biotech etf, shows a H&S top if the price action closes below the neckline today.
BIS is a 2 X short the biotech’s etf which shows it’s forming a possible inverse H&S bottom. The left shoulder was a bear rectangle and when the bottom rail gave way the head was formed. Now BIS is approaching the possible neckline. Symmetry suggests the right shoulder may need a little more work but if the neckline gives way a nice bottom should be in place for the BIS.
