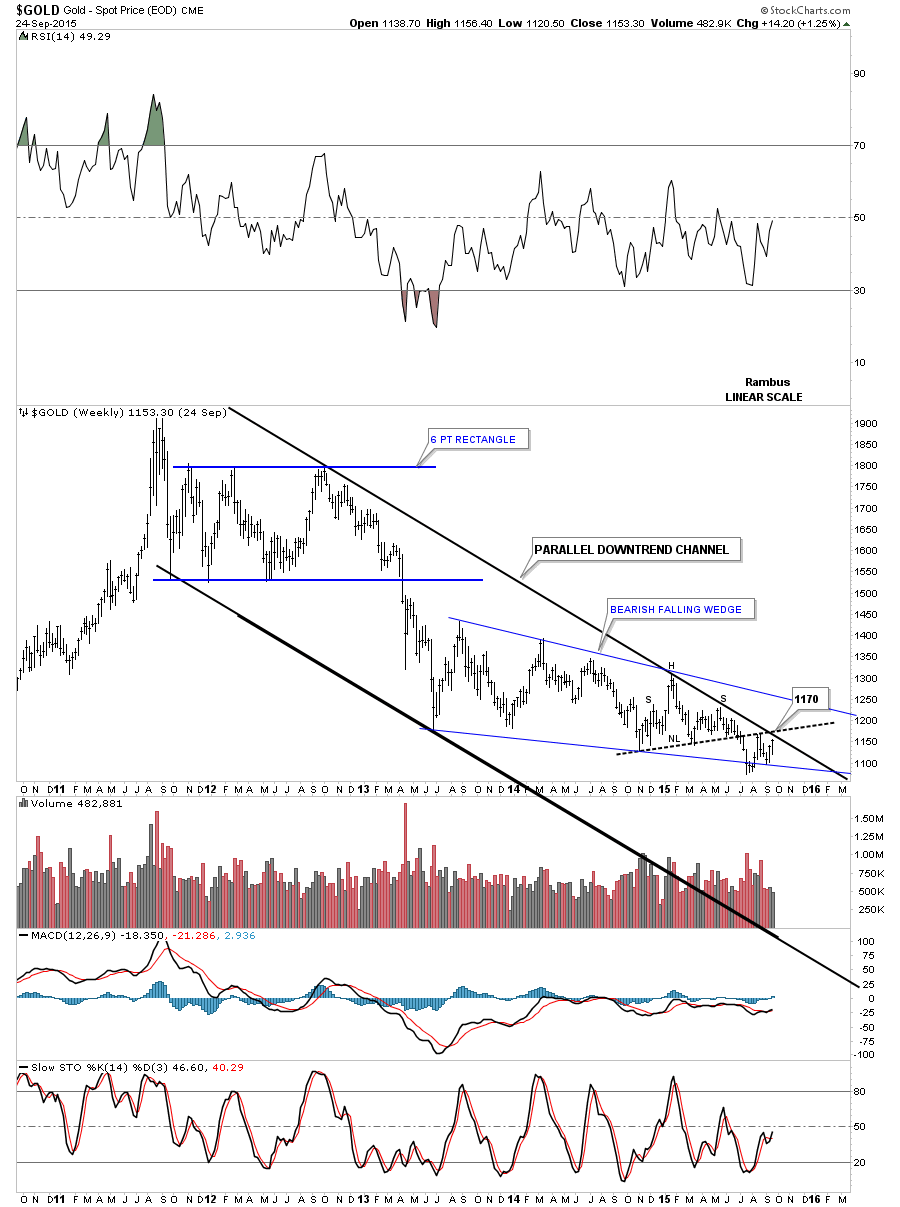
Its been awhile since I last showed you this long term weekly chart for gold, linear scale, that shows gold’s parallel downtrend channel. Yesterday gold got to withing about 15 points of hitting the top rail of the downtrend channel.
Below is the same chart but with a little less time on it so you can see the most recent price action a little closer. Note the H&S consolidation pattern that formed just below the top rail of the downtrend channel and the neckline that intersects with that top rail at 1170 or so. Those are two very important resistance lines to keep an eye.