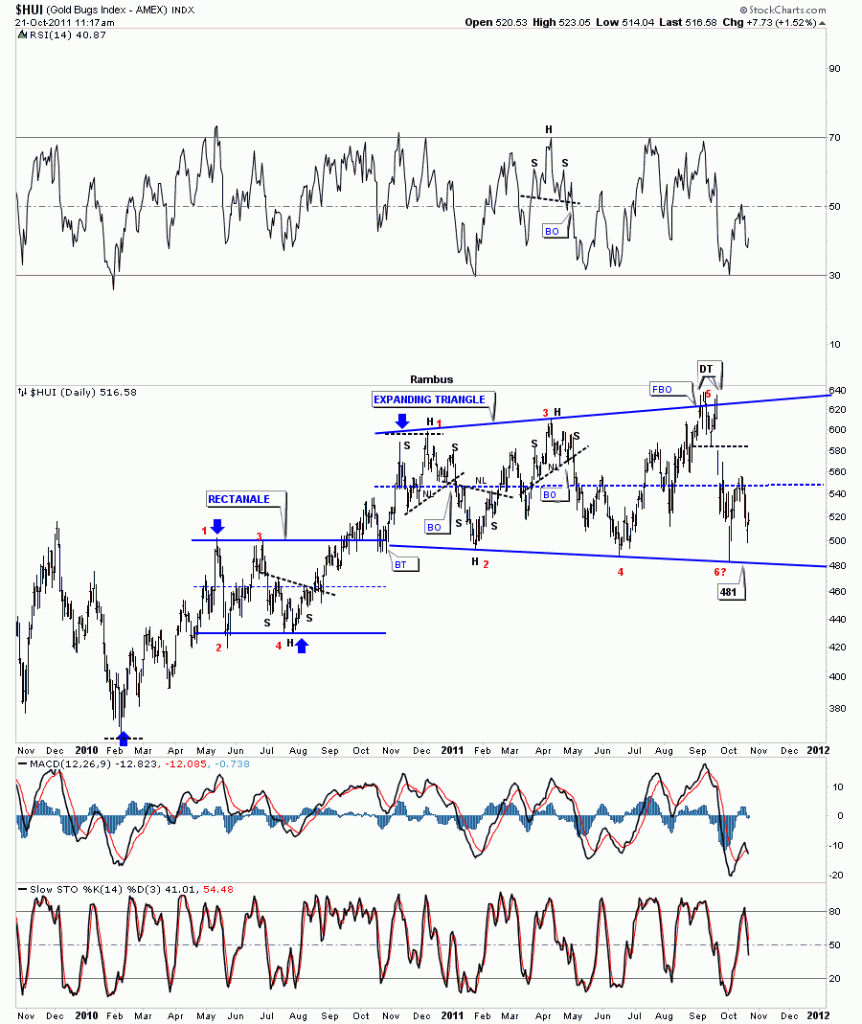
Below is a chart of our ever expanding triangle that has been forming for a year now. These type of patterns give you alot of false buy and sell signals by breaking out above the previous high only to reverse back inside the pattern with the same thing happening at the bottom of the trading range. Whipsaw city. What we do know is the expanding triangle is complete after it hit the top rail at point #5. You can see the double top at point 5 that led to our last leg down that finished at the bottom rail with a slightly lower low than the previous low back in June.. Our latest bounce off the bottom rail took us to the center of the consolidation pattern, dashed blue rail, where the rally petered out. In a big trading range like we are in you can see how most reversals within the expanding triangle were accompanied by some kind of reversal pattern, such as a H&S or double top or bottom. This is one reason I would like to see us touch the bottom rail one more time to complete a rather large double bottom that would call for a move all the way back to the top of the pattern. What we want and what we get can be two different things. Bottom line is we know the boundaries of the trading range and can act accordingly.
HUI daily look.

