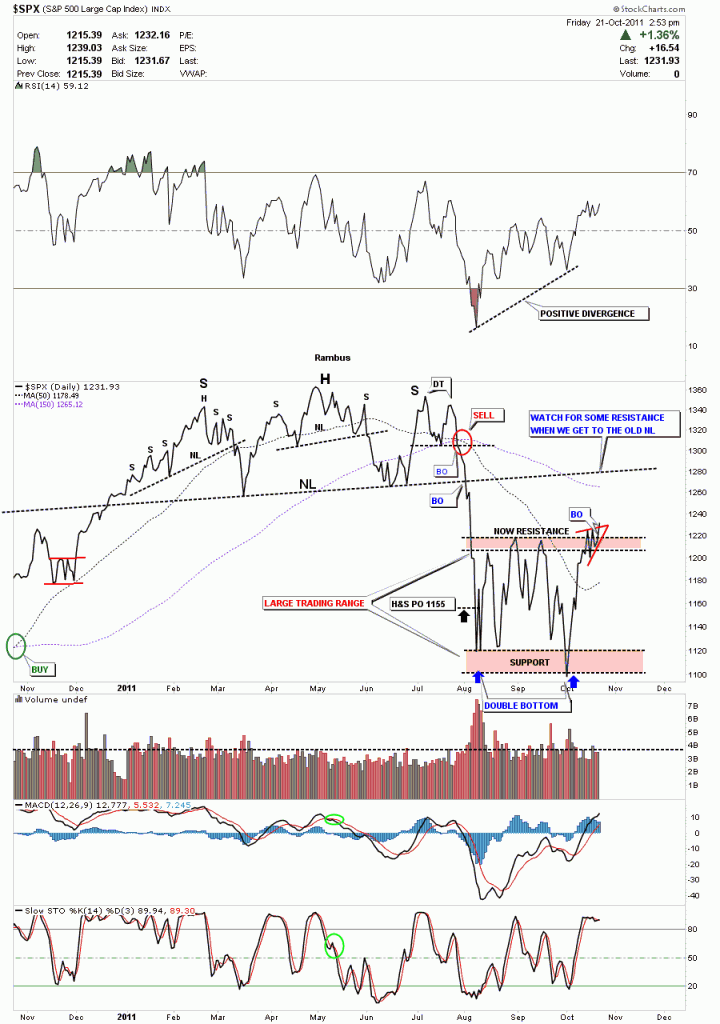
A couple of weeks ago I wrote an essay on why I thought the stock markets were on the verge of breaking out. Today’s action is now showing us a breakout to the topside is in progress. We looked at alot of long term charts to get rid of some of the noise from the short term look. Sometimes you have to step out of the forest to see the trees. I also said that the rally for the stock markets would be good for the precious metals stocks and bad for the dollar. So if you were looking for all the stock markets to crash and the world to end as we know it you may need to rethink what inflation is going to do to just about everything you can think of including the stock markets going up when emotionally thinking says just the opposite. Anyway today’s action is very positive IMHO.
Below is a daily line chart of the SPX showing the volatile trading range we have been in since we broke the neckline back in August. Note that we did hit the H&S price objective on the first leg down at 1155. Sometimes using a line chart helps takeout alot of the noise that a bar chart can show especially when there are inter day breaks of support and resistance zones. I’m going to classify our trading range as a double bottom at this time. To measure a double bottom or double top you just measure the distance from the bottom to the top of the range and add that distance to the top of the range to get your price objective for the double bottom in this instance. We should get some resistance at the old neckline where we might form some kind of small consolidation pattern. Note the positive divergence on the RSI above the chart.

