Its been a while since I last updated the GDXJ junior gold stock index. Of all the precious metals stock indexes this index has the nicest looking bearish falling wedge pattern which has been trading below the bottom red rail for 6 days in a row now. Also the blue 5 point triangle reversal pattern is the cleanest of all the PM stock indexes to.
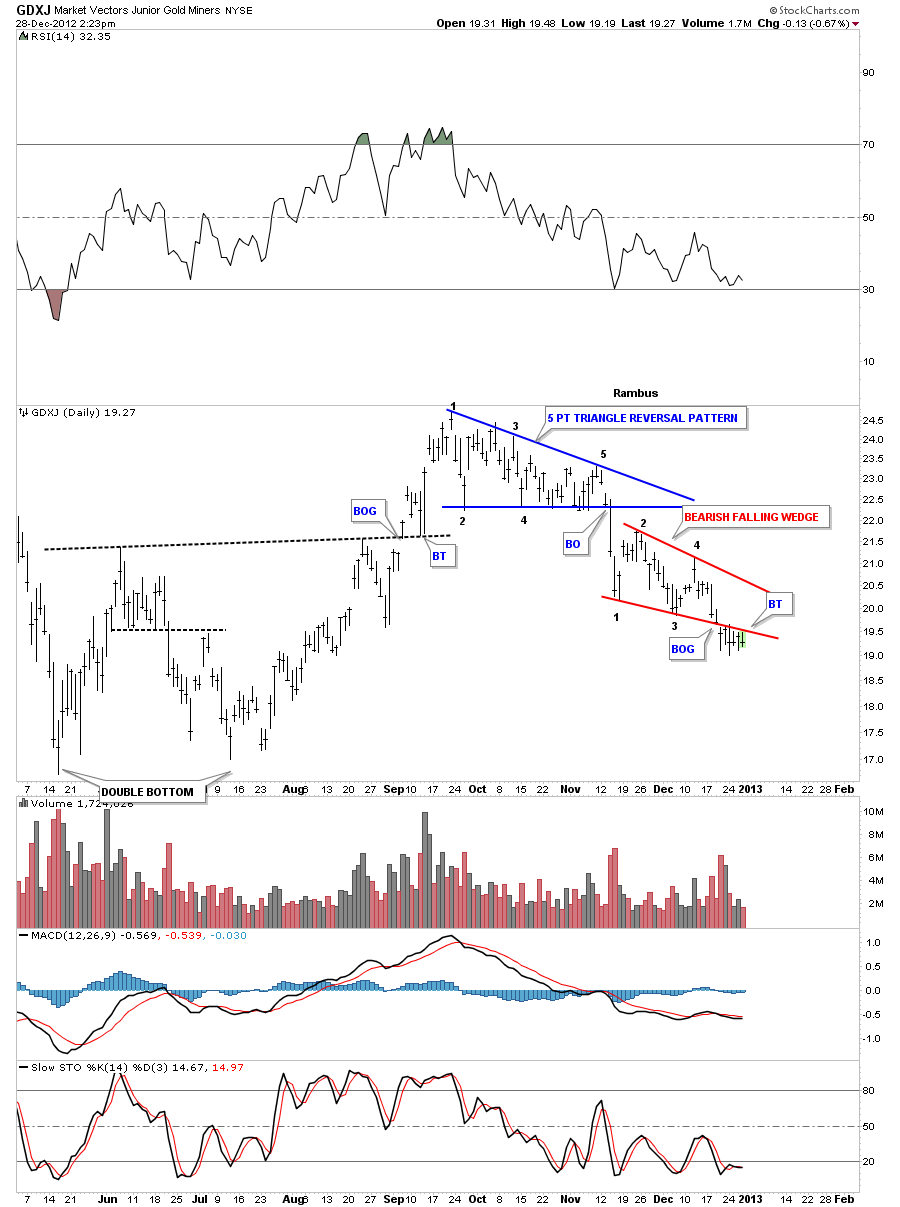
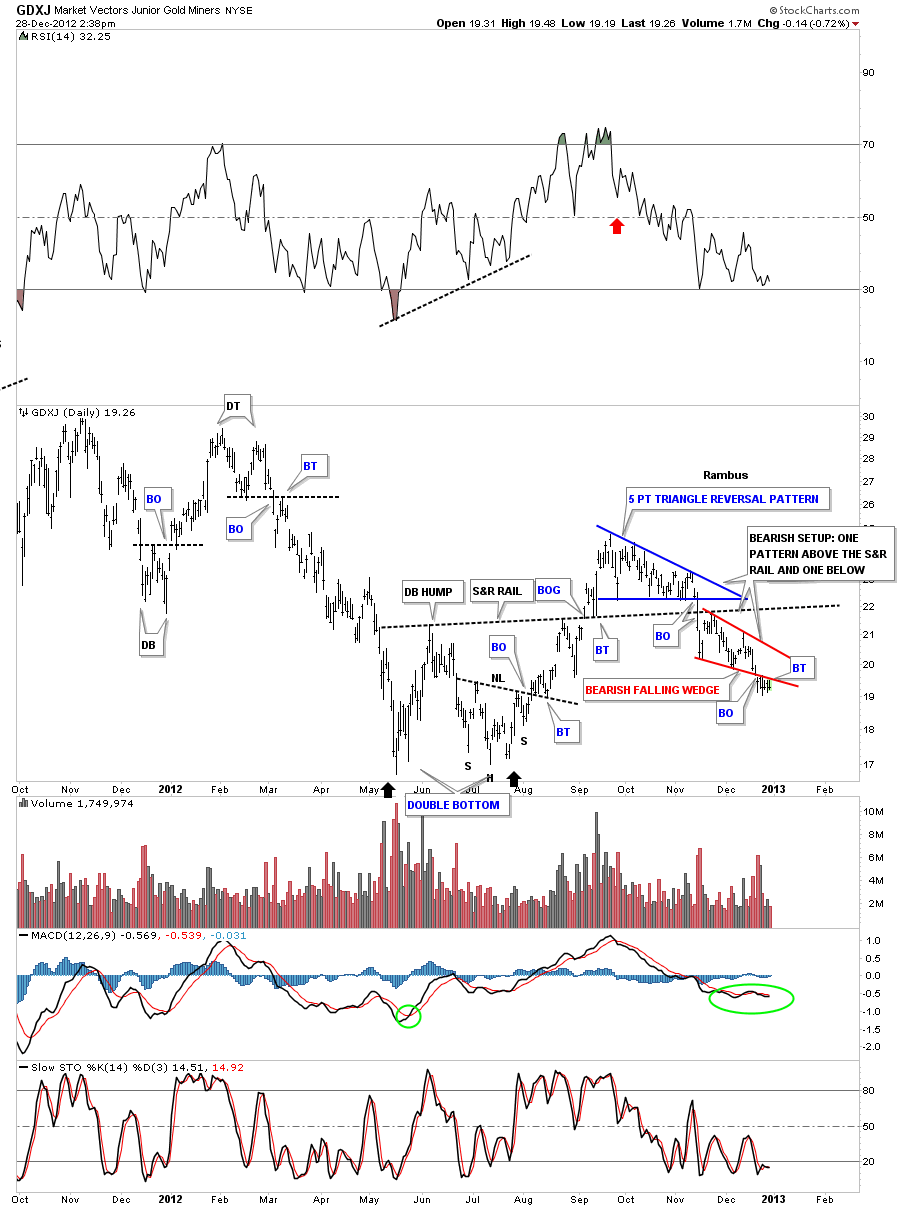
Lets now look at an 18 month daily chart that puts the above patterns into perspective. If you recall when the double bottom was complete and the price action broke above the double bottom hump it looked like, at the time, that we were well on our way to a nice big rally for the precious metals stocks. You can see the nice breakout and backtest to the double bottom trendline or the support and resistance rail, S&R rail, that showed everything was a go. After a week or so of rally the GDXJ began to correct, top of blue 5 point triangle reversal pattern. Even at that point everything still looked good as it was about time for a small correction. As the correction wore on the GDXJ couldn’t make any higher highs inside the blue triangle but the bottom blue rail held as support. Still this was a fairly normal correction. Then the breakout to the downside hit with a vengeance and in just 2 days the bottom rail of the blue triangle and the S&R rail were broken to the downside. That was a key technical failure and when we got our little backtest to the underside of the S&R rail that is where I put the model portfolio back into cash. I hated to do it but the breakdown left me no choice. Now what we have is a bearish setup with one pattern above the S&R rail and one below.
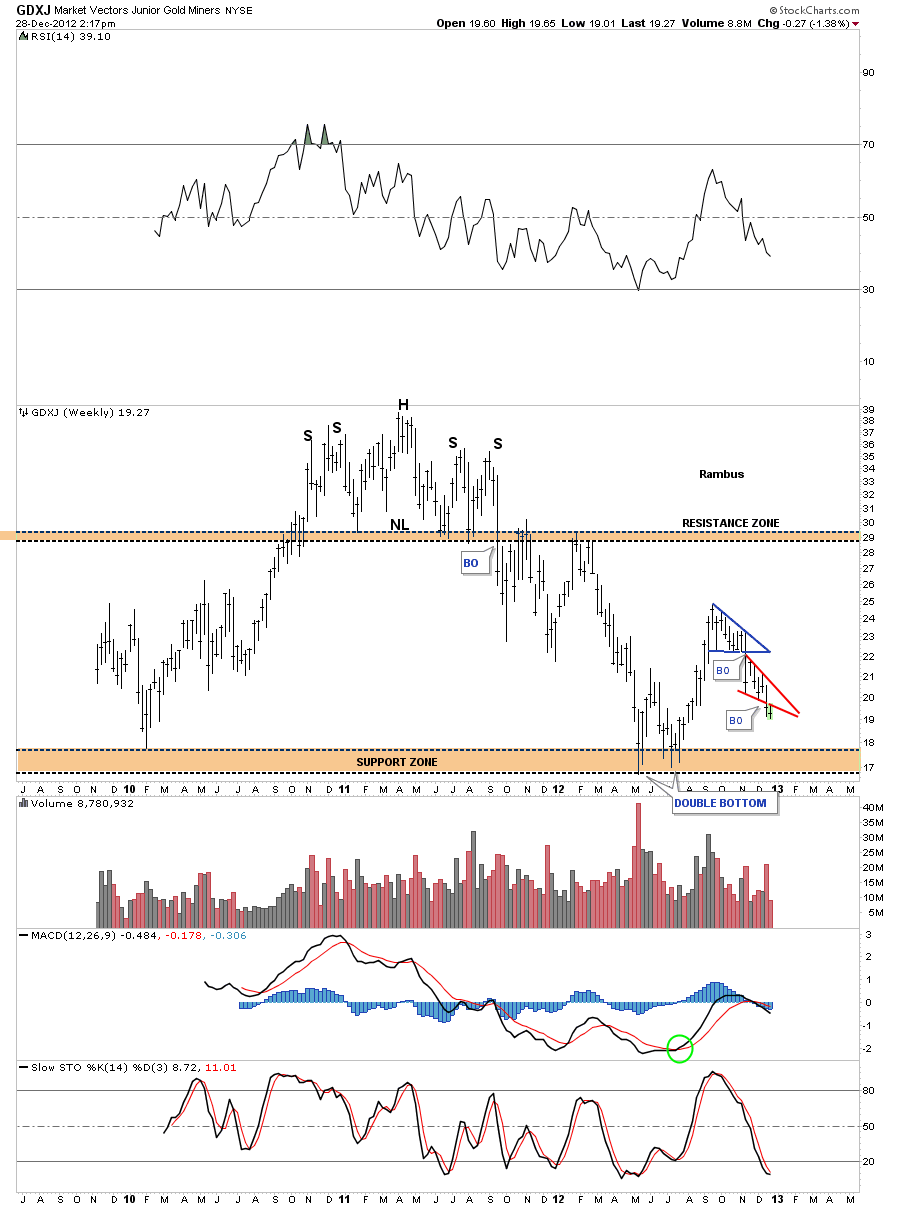
Next lets look at the weekly chart that is showing just how weak this junior index is. You can see our two pattern from the chart above, the blue triangle and the red falling wedge. We are not that far above the all time lows that formed back in May of this year.
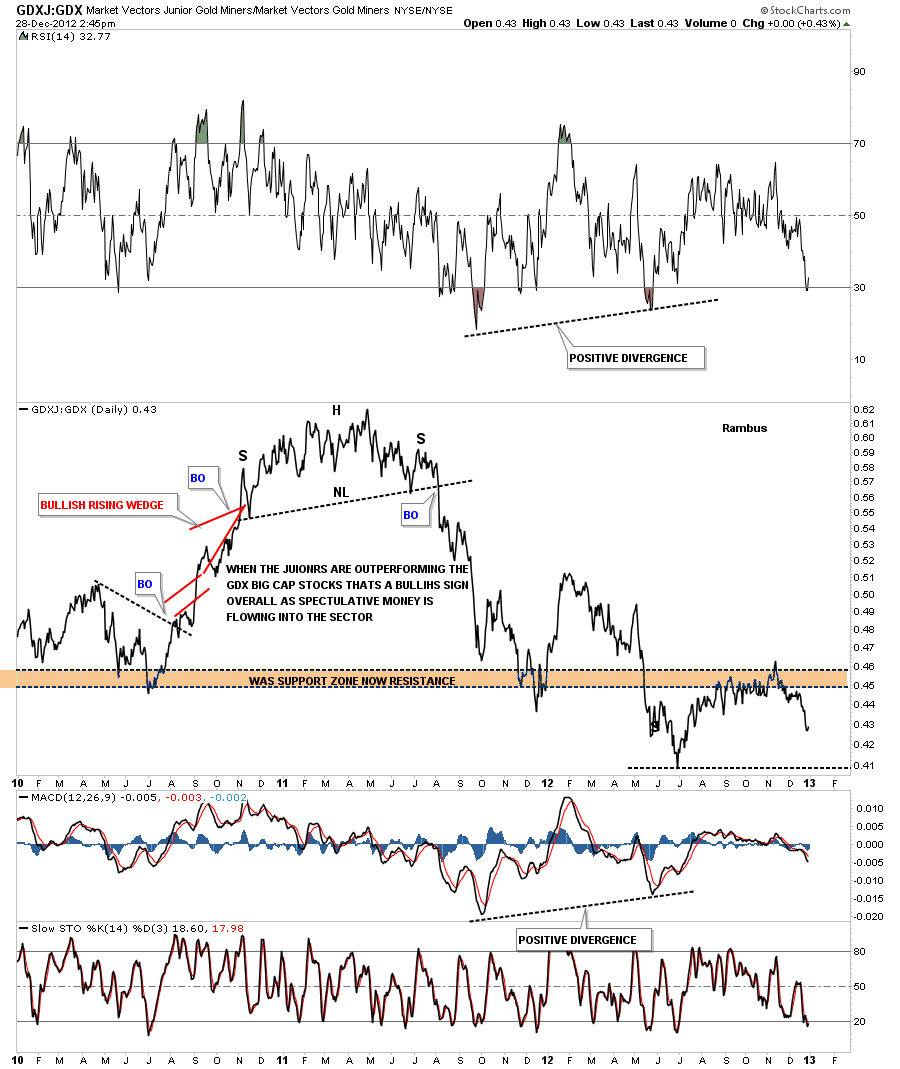
Normally when the precious metals stocks are in strong uptrends one likes to see the juniors outperforming the big caps as that suggests money is flowing freely and investors want to to take more risks so they bid up the juniors. Below is a ratio chart that compares the GDXJ to the GDX that is showing the junior mining companies are now rolling over to the downside after hitting resistance at the brown shaded area. This is not a healthy sign if you own the precious metals stocks.