This weeks “Chart Of The Week” was requested by a long time poster at the tent and friend aurum. He picked up some shares of GORO yesterday when everything was in the backtest mode, which is generally a good low risk entry point into ones favorite stock. As always we’ll start out with the 60 minute chart and work our way out to the long term monthly look.
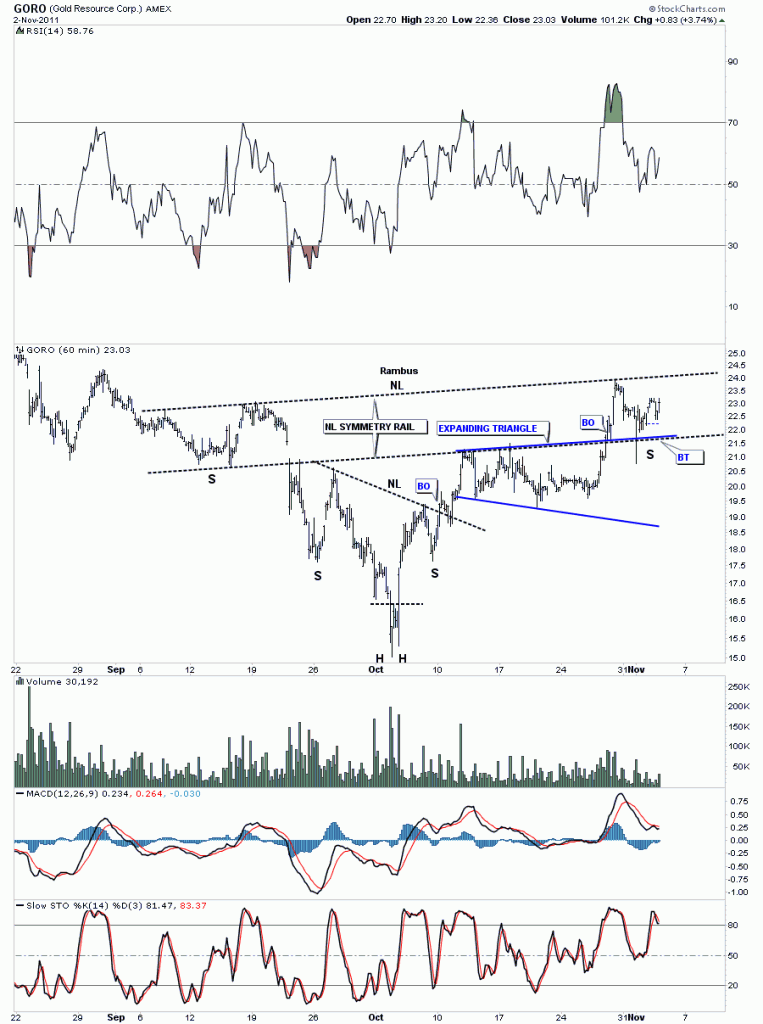
The 60 minute look shows GORO building out a nice basing pattern consisting of several H&S patterns and one expanding triangle. In order to launch a bull move a stocks has to have time to create a nice base which will be able to sustain a big move higher. I’ve added a neckline symmetry rail that sometimes gives you a clue on where to look for a possible bottom for the right shoulder. It doesn’t work all the time but it does give you something to shoot for.
GORO 60 minute multiple H&S base.
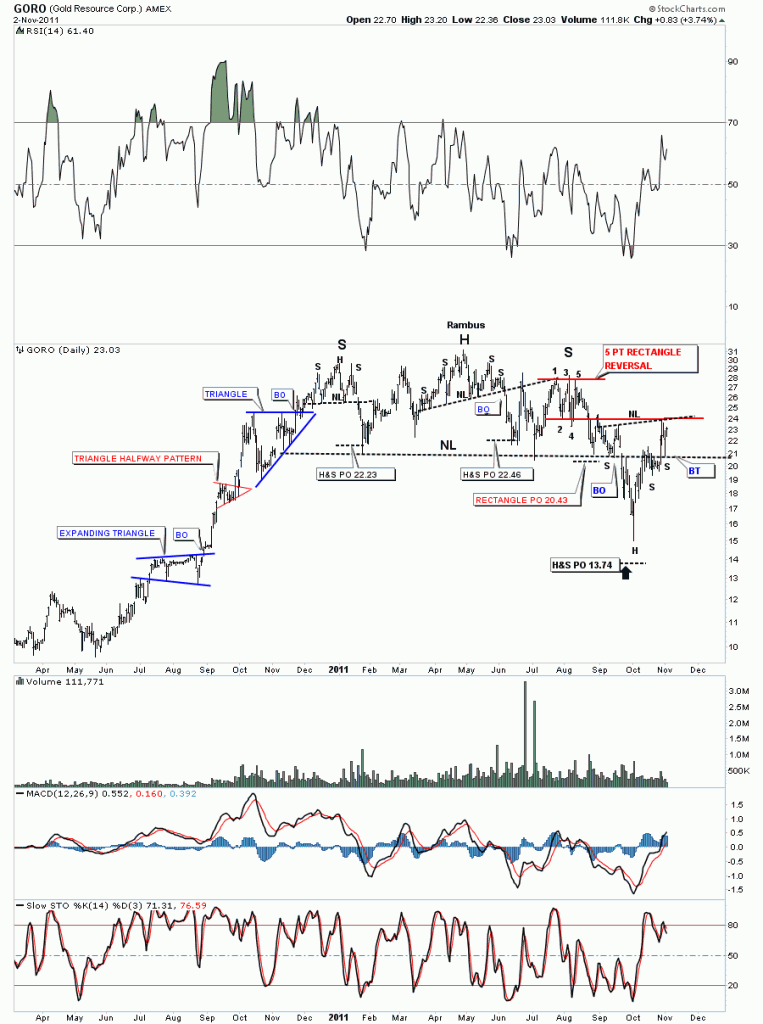
The daily look may seem a bit busy because there is alot to look at. I have run out of annotations to label anymore of the interesting things on the chart. Notice the left side of the chart when GORO was in its impulse move higher back in the 2nd half of 2010. One consolidation pattern was formed on top of the next creating a very exciting leg up. The little red triangle was a halfway pattern that measured to the top of the bigger blue triangle just above. The impulse leg ended in late 2010 where the stock began it;s long awaited correction. The sideways move created 2 H&S tops and one 5 point rectangle reversal pattern These three patterns created a much bigger H&S top that broke down toward the end of September along with most PM stocks. The big H&S price objective fell just shy of it’s objective. The long tail that was made at the low suggested very strongly that the move down was probably over. You can see how the big neckline has worked as support and resistance giving validity to the pattern. Yesterday’s sharp move lower found support right on the neckline where the stock has had a nice bounce. There is another chart pattern that’s hard to see on the daily look but stands out on the less crowed weekly look.
GORO daily H&S
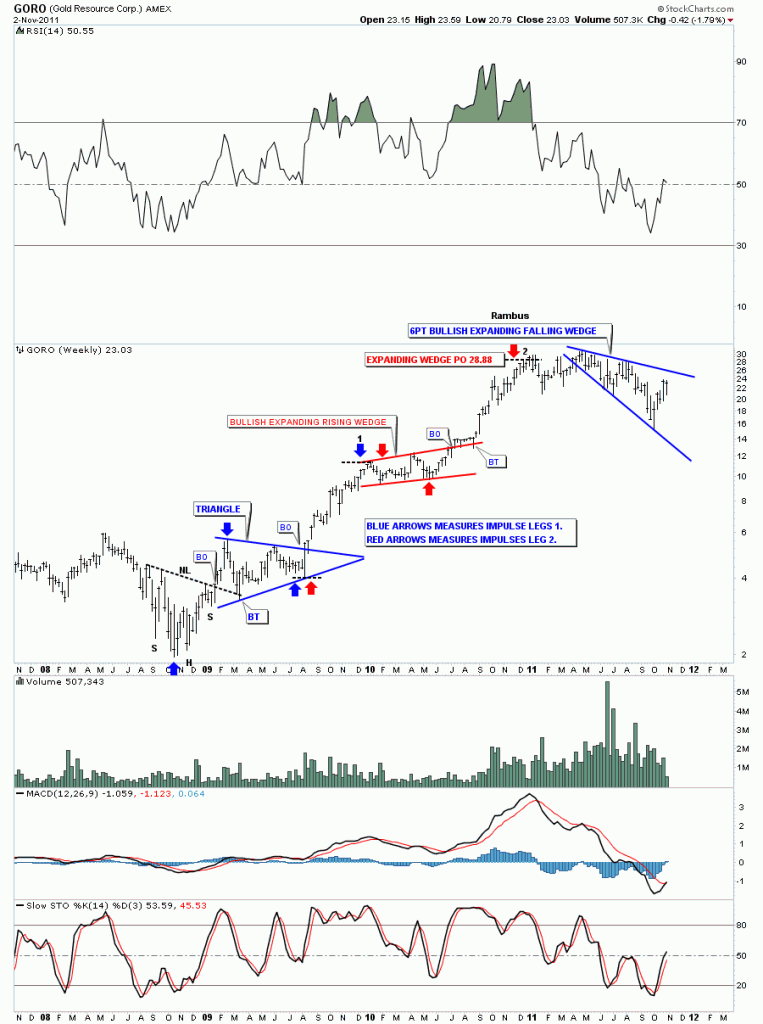
The weekly look really put GORO’s bull market into perspective. After bottoming out in 2008 with alot of other precious metals stocks, it started the base building process that built out a very nice H&S base in which to launch it’s bull market run. What I find fascinating about it’s bull market run is that each of the impulse legs up are almost exactly the same length. If you have a fib tool or can draw a box, just measure the first 2 blue arrows, one at the bottom of the chart and the next at the top of the first triangle consolidation pattern. Take that measurement and add it to the last reversal point in each consolidation pattern, where the blue or red arrows are. The markets never cease to amaze me. Next we’ll look at our most recent pattern which is a 6 point bullish falling expanding wedge. These patterns are more common when one starts to look for them. At any rate a breakout above the top rail should launch the next leg of it’s bull market along with many other precious metals stocks.
GORO weekly look.
Bottom line with GORO is that it looks like it’s in the process of finishing up another consolidation pattern once it breaks through the top rail of the 6 point expanding falling wedge. As GORO doesn’t have alot more history we’ll stop here as the weekly look shows you everything you need to see. All the best aurum……Rambus


