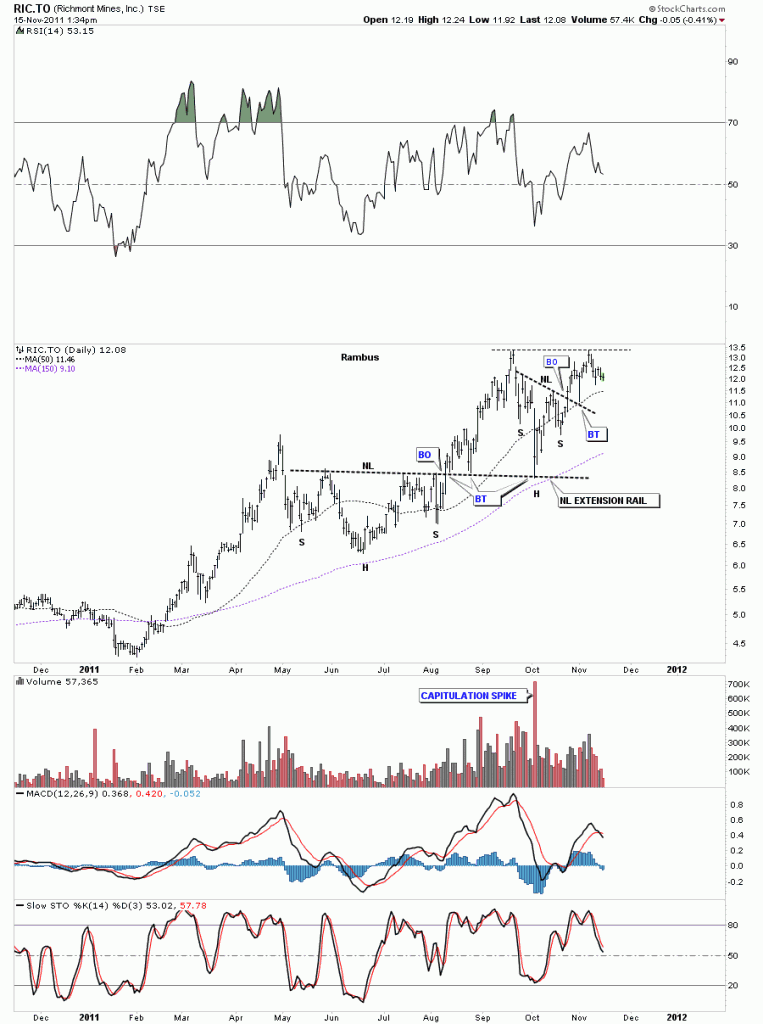
Today I want to show another model portfolio stock Richmont Mines that is sitting just beneath it’s all time highs. Below is a one year chart showing 2 H&S consolidation patterns that makeup it’s recent uptrend. The lower H&S consolidation pattern formed during the usually slow summer months and broke the neckline in August signaling the H&S was complete. Notice that once we broke through the neckline, that had been resistance, we had 3 backtests that were all successful. The neckline was now acting as support. The last critical backtest occurred in October and the neckline held on a capitulation spike that marked the low. From there RIC rallied up to make new all time highs, where the second H&S consolidation pattern formed. Again notice how the neckline, once broken to the upside, held support on the backtest.
RIC.TO daily H&S consolidation patterns.
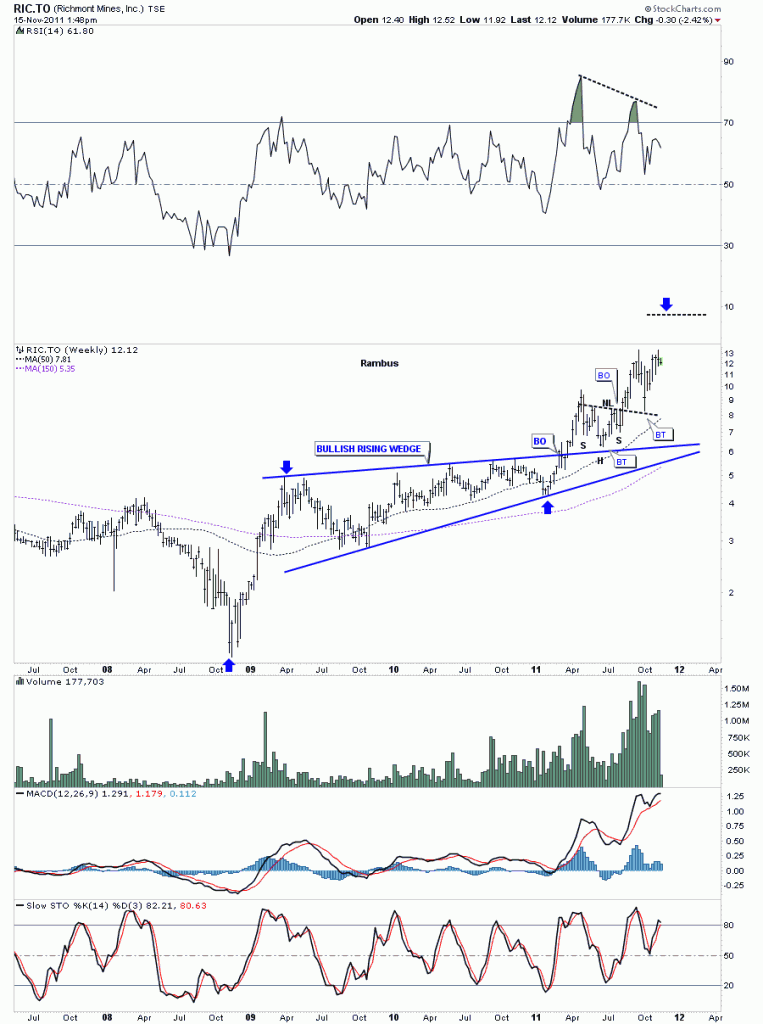
Now on to the weekly look showing a beautiful bullish rising wedge consolidation pattern. You can see how the top rail of the bullish rising wedge held resistance during it’s two year development. Once the top blue rail of the bullish rising wedge was broken to the upside it held as support that was instrumental in the creation of the lower H&S consolidation pattern that I showed on the daily chart. The backtest ended up being support for the head.
RIC.TO weekly bullish rising wedge.
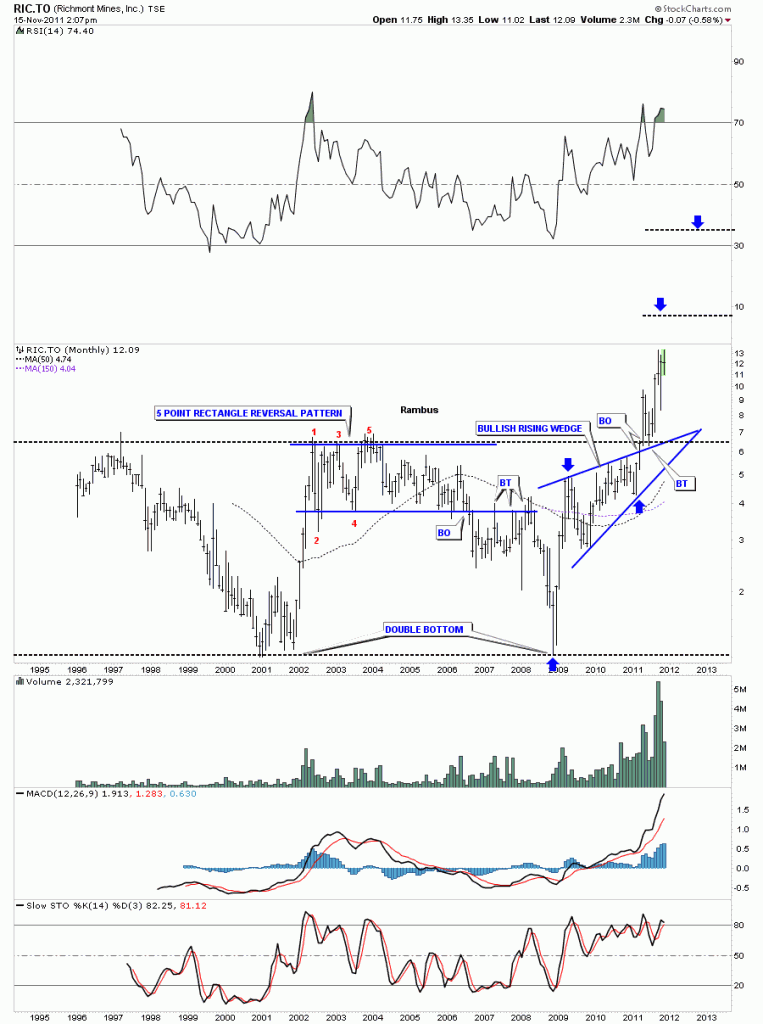
The monthly look really brings into focus just how bullish Richmont Mines is on the longer term chart. Unlike most precious metals stocks RIC.TO brokeout to new all time highs in April of this year while most PM stocks have lagged badly. Notice the top back dashed rail and how it worked it’s magic going from resistance to support once it was broken to the upside. Richmont Mines appears to be one of the leading precious metals stocks that will be a leader once the next impulse leg up gets started in earnest.
RIC.TO monthly look.


