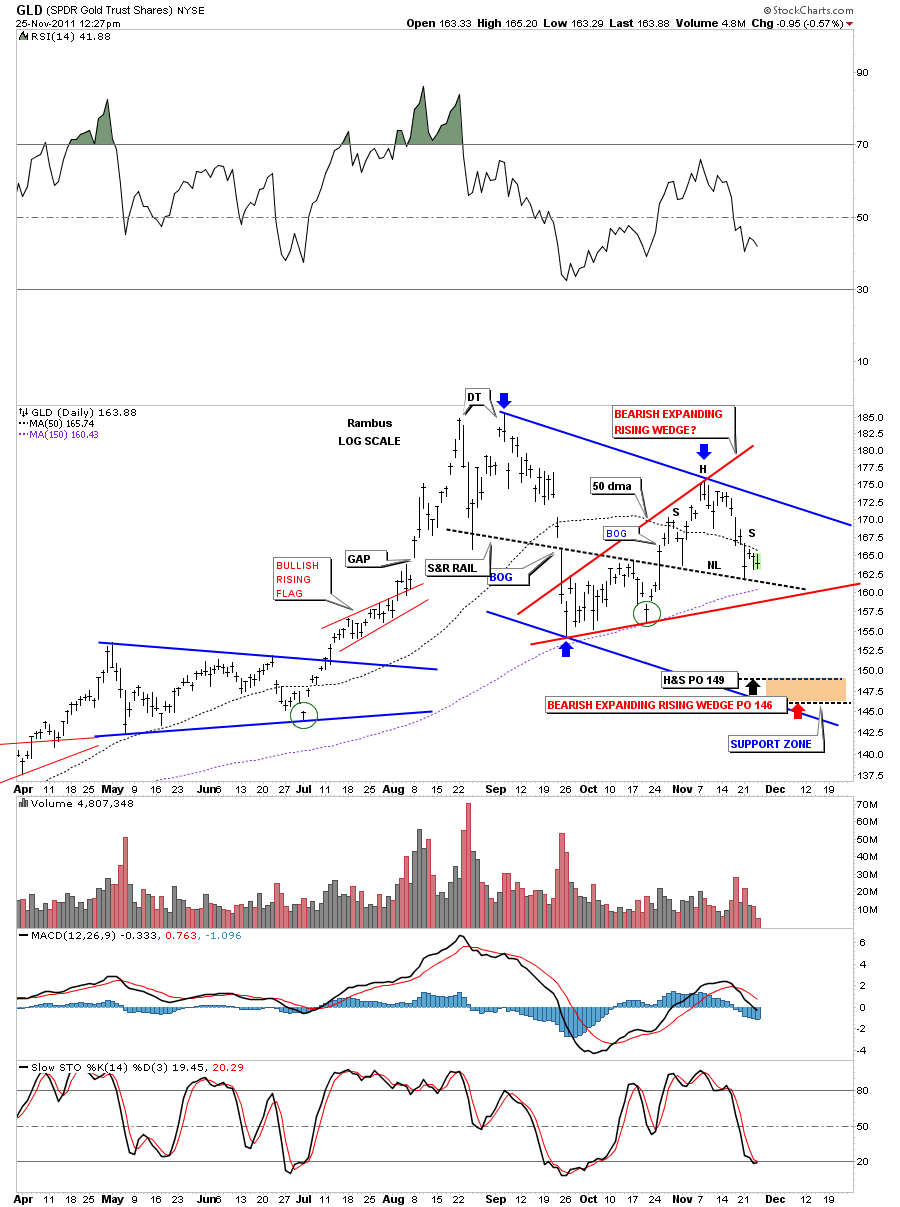
Below is an 8 month daily chart of GLD that I showed the other day. You can see the possible H&S that is forming on the S&R rail. We haven’t broken the neckline yet but the situation is looking more ominous as each day passes. Please notice the 2 blue arrows. One at the top of the chart at 1920 and the lower one at 1550 or so. Look hard at that decline. What you are seeing will be similar to what lies ahead for this next impulse leg down. A decline in price and time will be fairly equal to the first leg down off the 1920 top. If you still haven’t got your hedge on yet the next 3 to 4 weeks could be very painful if the neckline and the bottom rail of the red bearish expanding rising wedge fails. I plan on doing a more indepth weekend report based on this weeks support breaks on the stock markets and the dollar pattern that has developed, which will have a huge impact on the stock markets and the precious metals and stocks.
GLD 8 month little H&S top and the bigger bearish expanding rising wedge.

