Last week I showed many H&S patterns that were still in the developing stage of their right shoulders. This week we got the neckline breakdown from their H&S topping patterns that is suggesting, in no uncertain terms, that deflation is going to rear it’s ugly head. Just about every index I showed you in the last Weekend Report have broken their necklines. To make this breakout “Picture Perfect” is for a small counter trend rally back up to the underside of the necklines which would be the last bit of work that needs to be done before the next impulse leg down gets underway in a big way. This would be a good place to reread last weekend’s report on all the H&S patterns that were still trading above their necklines. http://rambus1.com/?p=1583. As this weeks price action was so critical to the big picture, we’ll look at those same H&S topping patterns, from last weeks report again, so you can follow along and see the breakout process up close and personal.
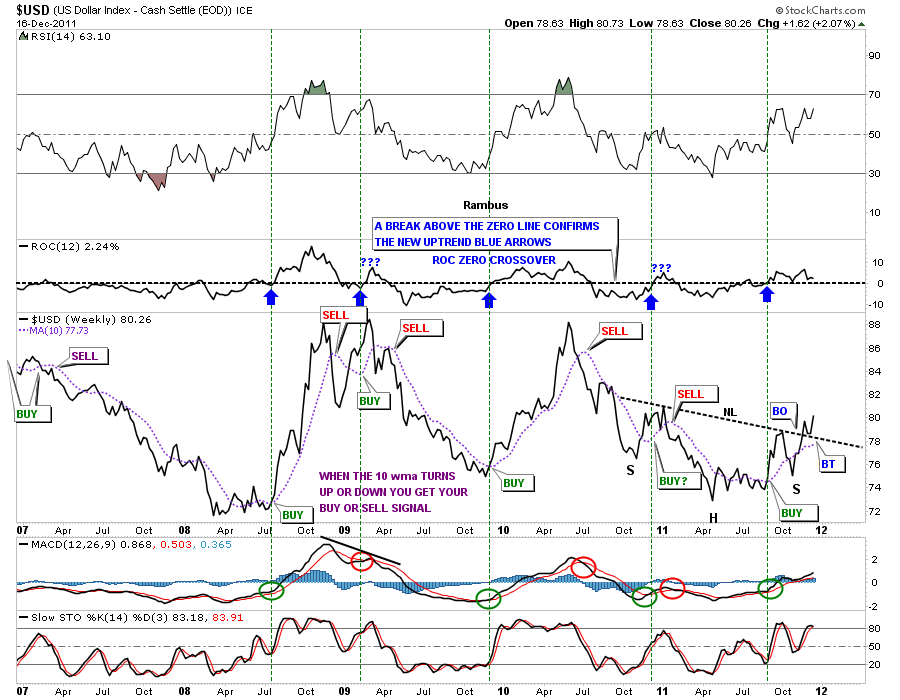
We’ll start with the all important US Dollar index that is most critical in understanding the big picture. I used a line chart that showed how the dollar had already broken the neckline and was in the process of doing it’s backtest. So far its picture perfect.
US Dollar weekly line chart with H&S breakout and backtest complete.
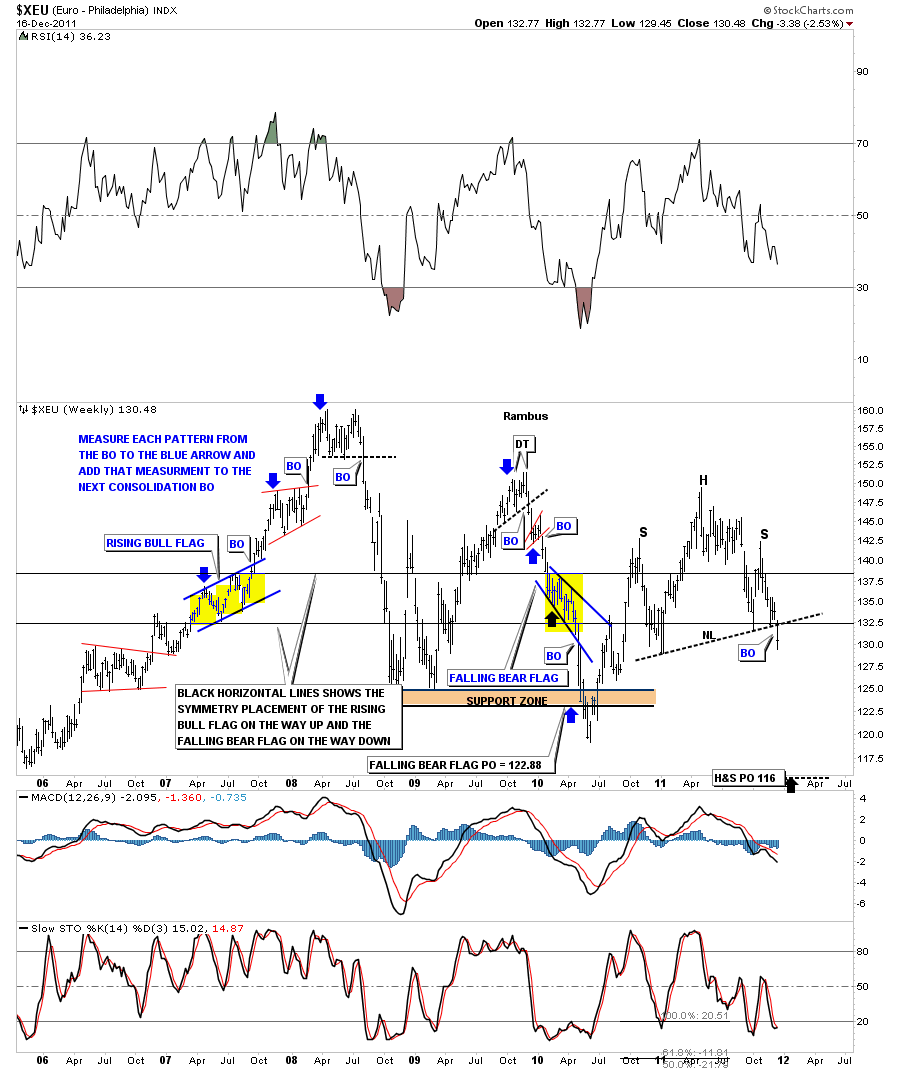
Next is a weekly look at the Euro and it’s inverse look to the dollar. If the dollar is putting in a H&S bottom then the Euro is putting in a H&S top. This bar chart shows this weeks breakout from the H&S top formation. One nice long bar through the neckline says it all. The only question now is if we’ll get a backtest to the underside of the neckline.
Xeu weekly H&S top breaking the neckline.
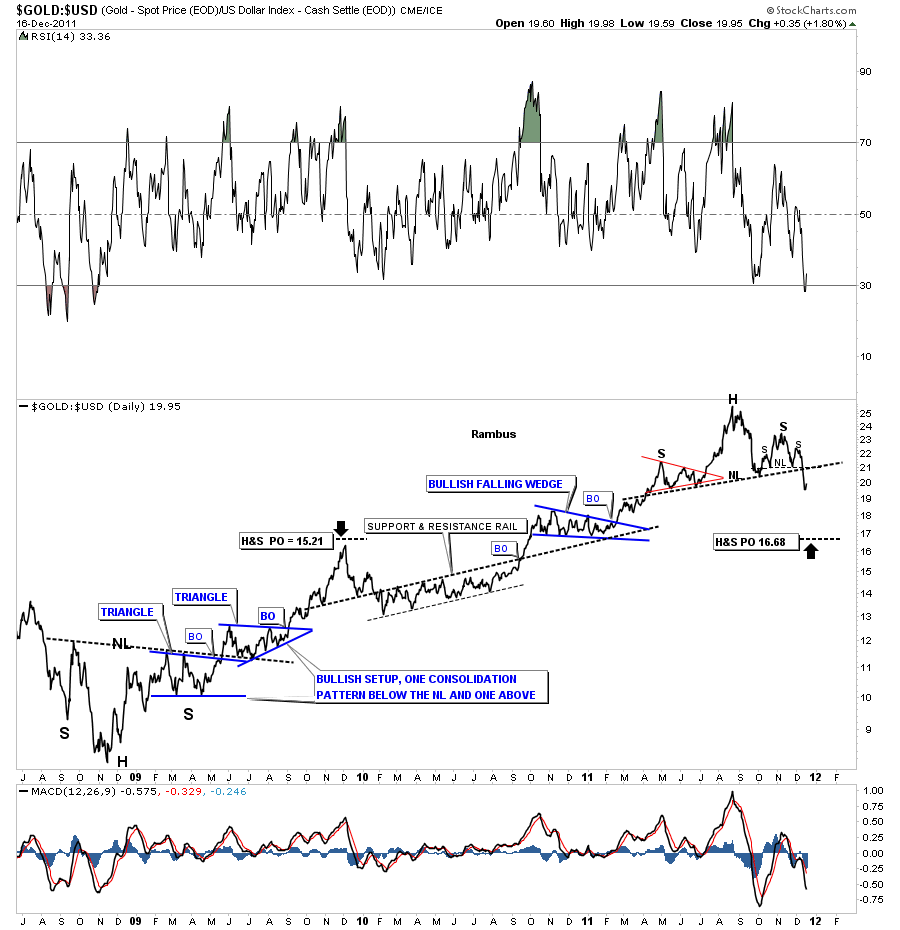
I have been showing the gold to the US Dollar ratio chart for awhile now. Last week I said it was a very ominous looking chart and that if it broke the neckline, to the downside, would not be a very good sign for gold. As you know gold fell hard this week against the US dollar which broke the neckline confirming the H&S pattern has topped. We could now see a short term rally to the underside of the neckline as it’s backtest before the next impulse leg down gets started in earnest.
Gold to the US Dollar ratio chart showing the breakdown from the neckline.
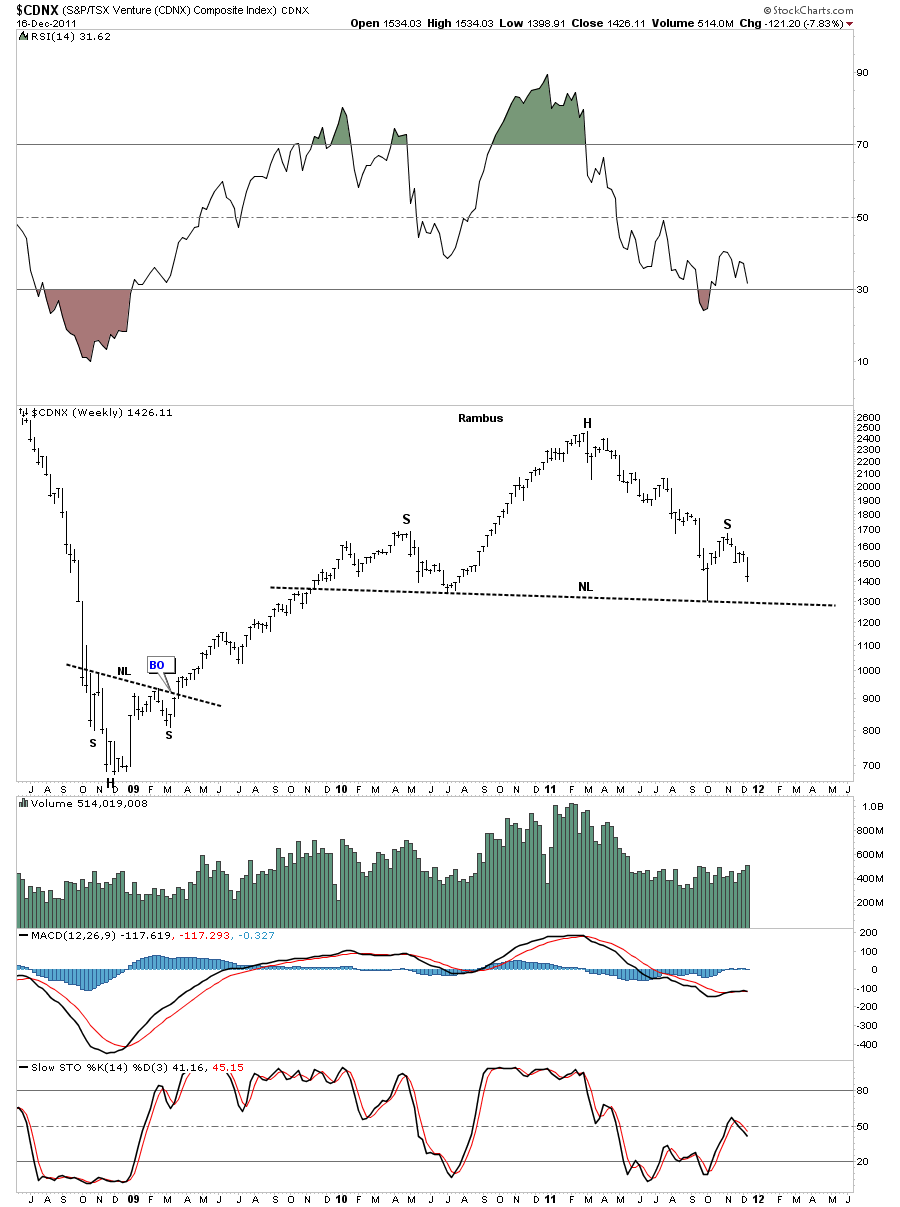
The next chart is the CDNX index where many of the small cap mining and oil companies are located. You can see the CDNX is still building out the right shoulder of it’s H&S top. If you own a bunch of small cap mining companies this is a good chart to keep a close eye on because it led the precious metals stocks lower back in the 2008 crash.
CDNX small cap index working on the completion of it’s right shoulder.
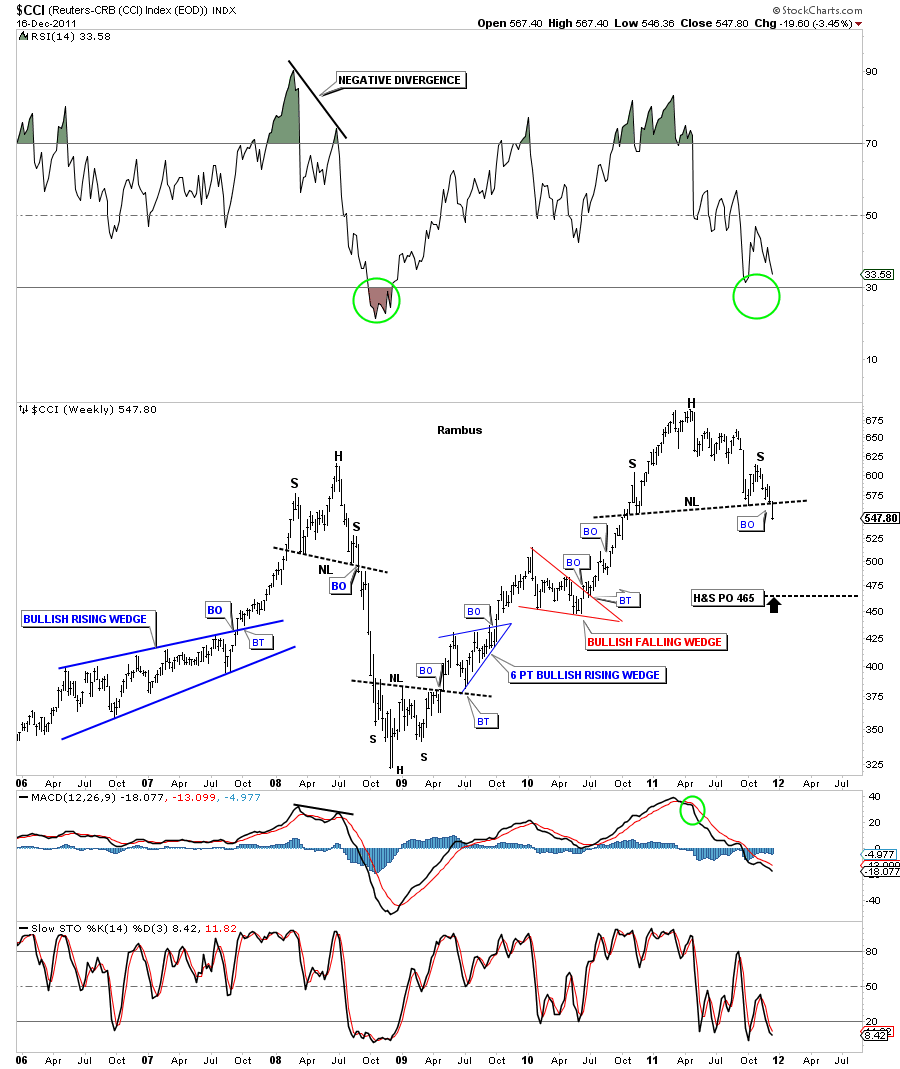
Last week the CCI commodities index was sitting right on the neckline. This week you can clearly see it has broken support at the neckline. I hope I’m painting a clear picture of what is unfolding right before our very eyes.
CCI weekly H&S breakout. Will we get the backtest?
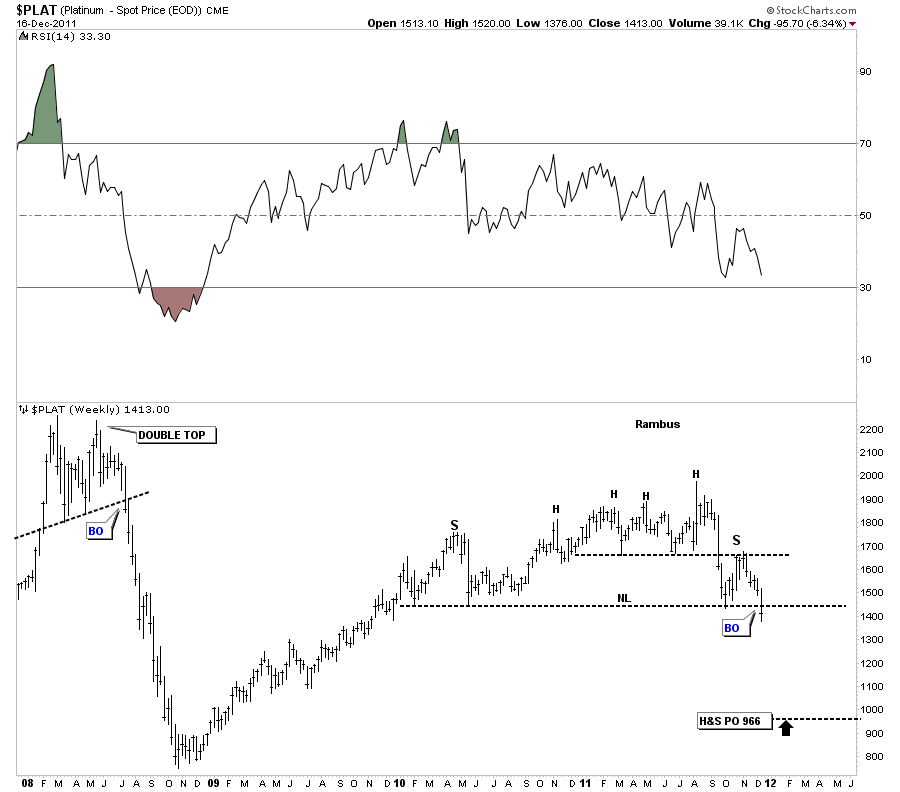
Platinum was also sitting above it’s neckline as last weeks trading ended. This week you can clearly see the neckline was broken. If Platinum is breaking down so must the other precious metals. Again you can see where there is just a little wiggle room for a backtest to the neckline.
Platinum weekly H&S breakout.
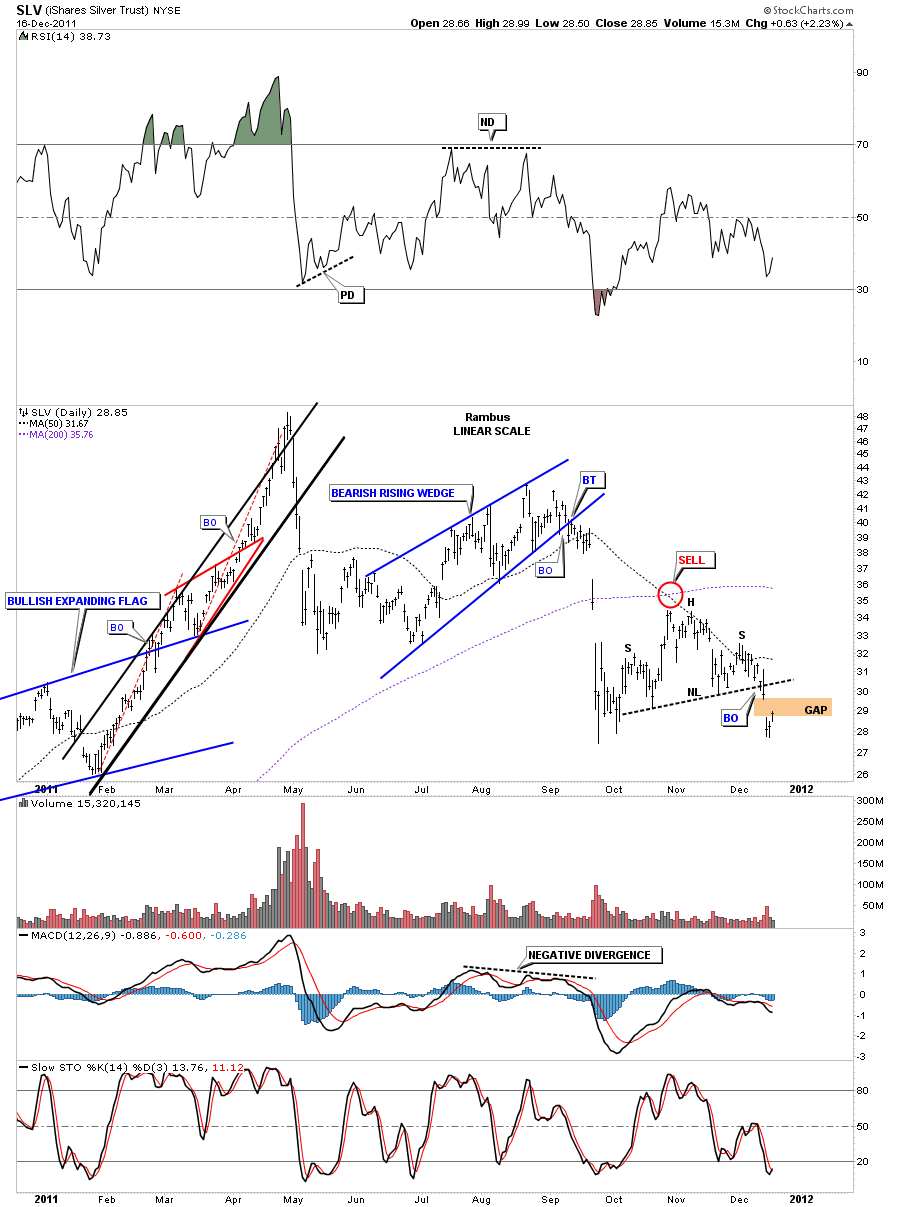
Lets now focus on silver and gold to see how this weeks price action showed the completion of several H&S patterns. First, SLV broke it’s small, right shoulder H&S pattern on Tuesday of this last week. You can see the huge gap that formed on the breakout move. Here again you can see the potential for a backtest to either the neckline or just high enough to close the big gap. So alittle strength at the beginning of the week should be expected for the backtest move. Should be expected but not guaranteed.
SLV daily H&S breakout of right shoulder.
The daily chart for silver shows the breakout from the small H&S, above chart, that formed the right shoulder of the much bigger H&S topping pattern. What this weeks action did was break two H&S pattern necklines, the small right shoulder and the big H&S top neckline. A backtest to 31.50 should offer stiff resistance if we get it.
Silver H&S top with 2 necklines being broken this week.
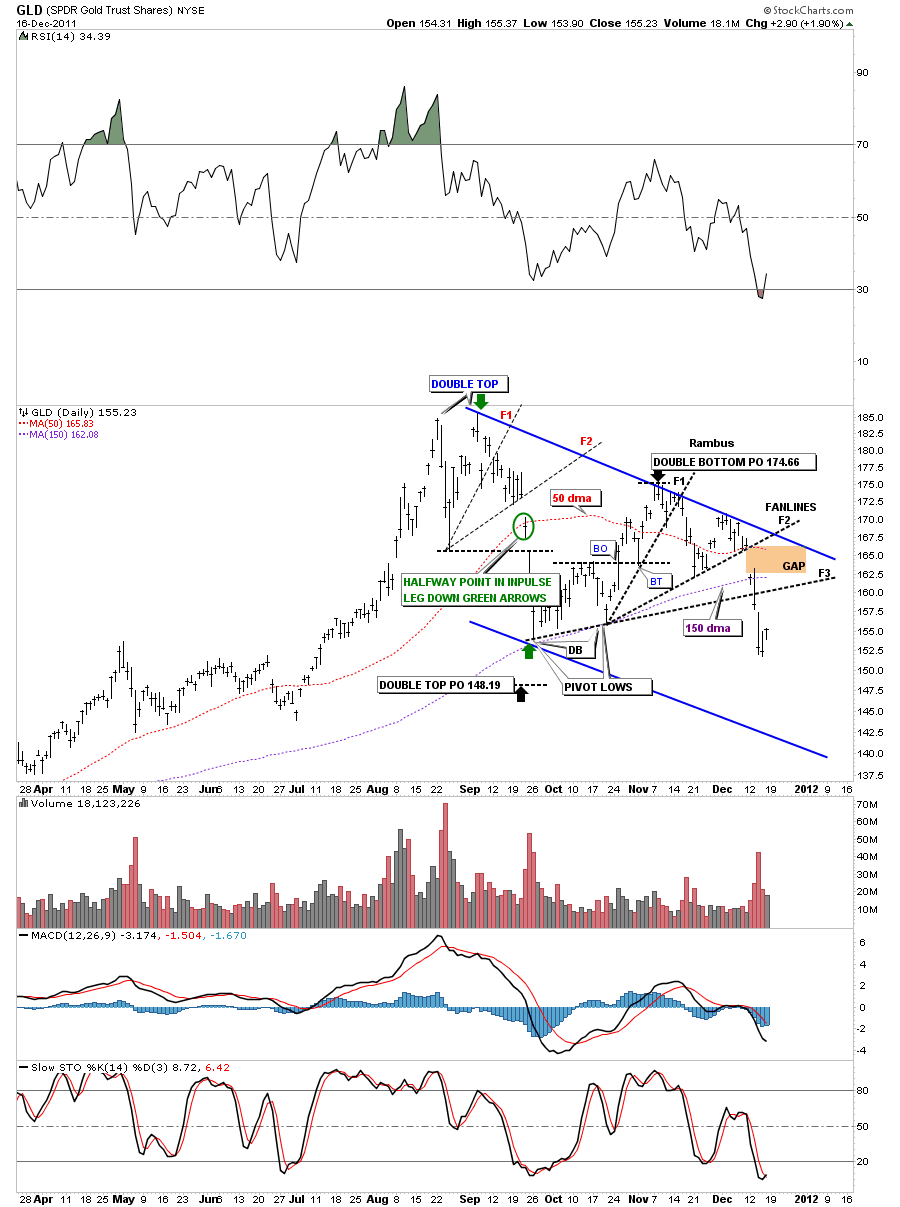
A week ago I showed this chart on Gold showing the fanlines. At the time we were sitting right on black fanline # 2. You can see the big gap that accompanied the breakout from fanline #2 on Monday. The third fanline didn’t offer any support as we plowed right through a potential support rail. If we get any type of counter trend rally this week I would expect that fanline # 3 would act as resistance.
GLD daily fanlines.
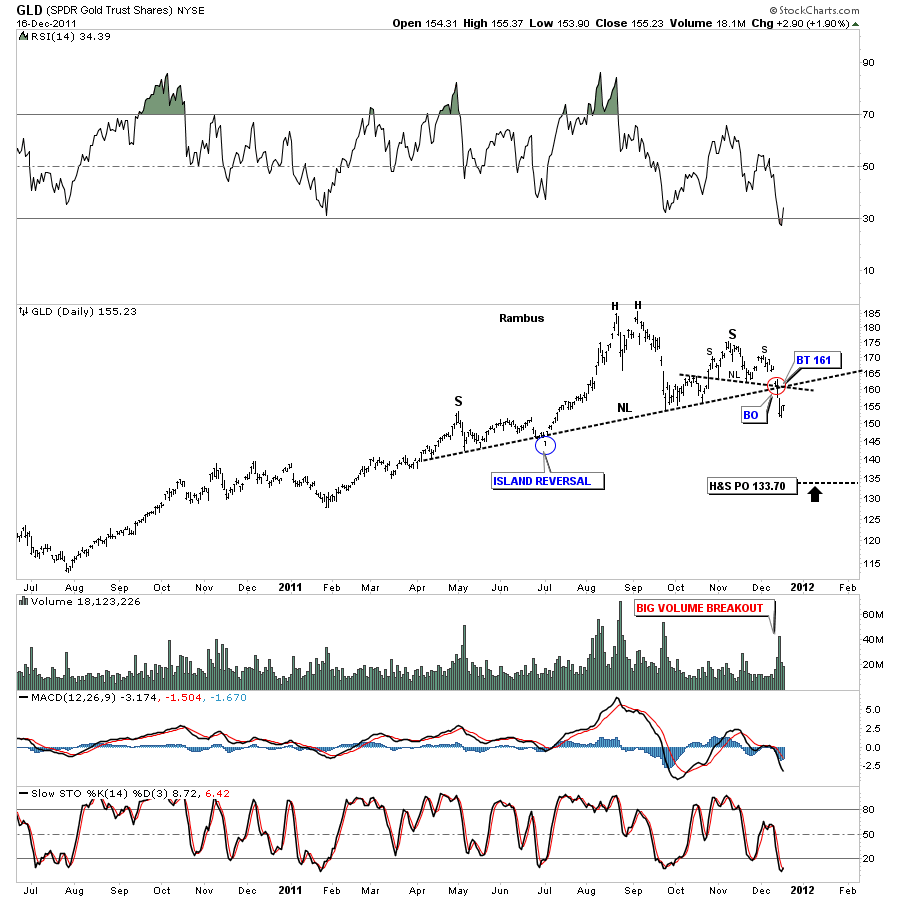
One last chart for Gold. You can see that we could be building a serious H&S topping pattern going all the way back to May of this year. As with silver, GLD formed a beautiful small H&S right shoulder, of the much bigger H&S pattern. I put a red circle around the breakout of the two necklines. Any little counter trend rally to backtest the necklines should be stopped at the 161 area which would be a good low risk entry point for short.
GLD daily H&S breakout and possible backtest.
So the bottom line is that last weeks big decline for the risk off trade is starting to confirm that a serious bout of deflation maybe starring us directly in the eyes. Its no coincidence that we are seeing so many H&S tops being completed. Alittle strength this week should be expected that will put the last nail in the coffin showing that deflation and the risk off trade is how you want to play the markets going forward. I’ve said before and I’ll say it again its time to protect your hard earned capital by whichever means necessary. Keep in mind that markets go down alot faster than they go up.
All the best…….Rambus

