Subscriber DONZI says he watches the $TSX as a general guide for the metals markets. He wants to know if I see the same H&S top pattern he is seeing. This index is very similar looking to the CDNX which is a Canadian small cap resource exchange that has many junior precious metals and oil stocks.
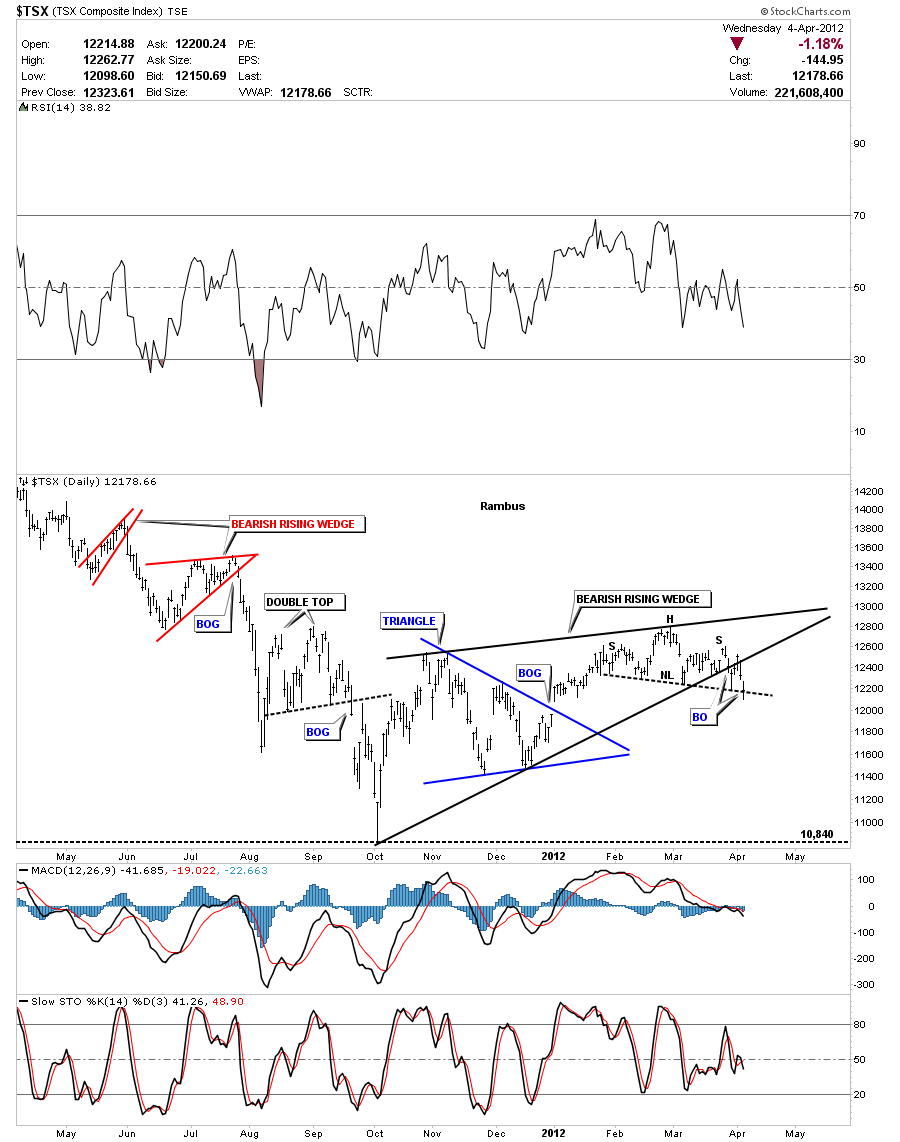
The lets look at the daily chart that is showing a bearish rising wedge that broke down about 5 days ago. It had a strong backtest to the bottom black rail. There is also a H&S top out toward the apex of the bearish rising wedge that cracked the neckline today. This is not a bullish looking chart. There are two big negatives, the bearish rising wedge and the H&S top pattern. This daily chart is suggesting lower prices dead ahead.
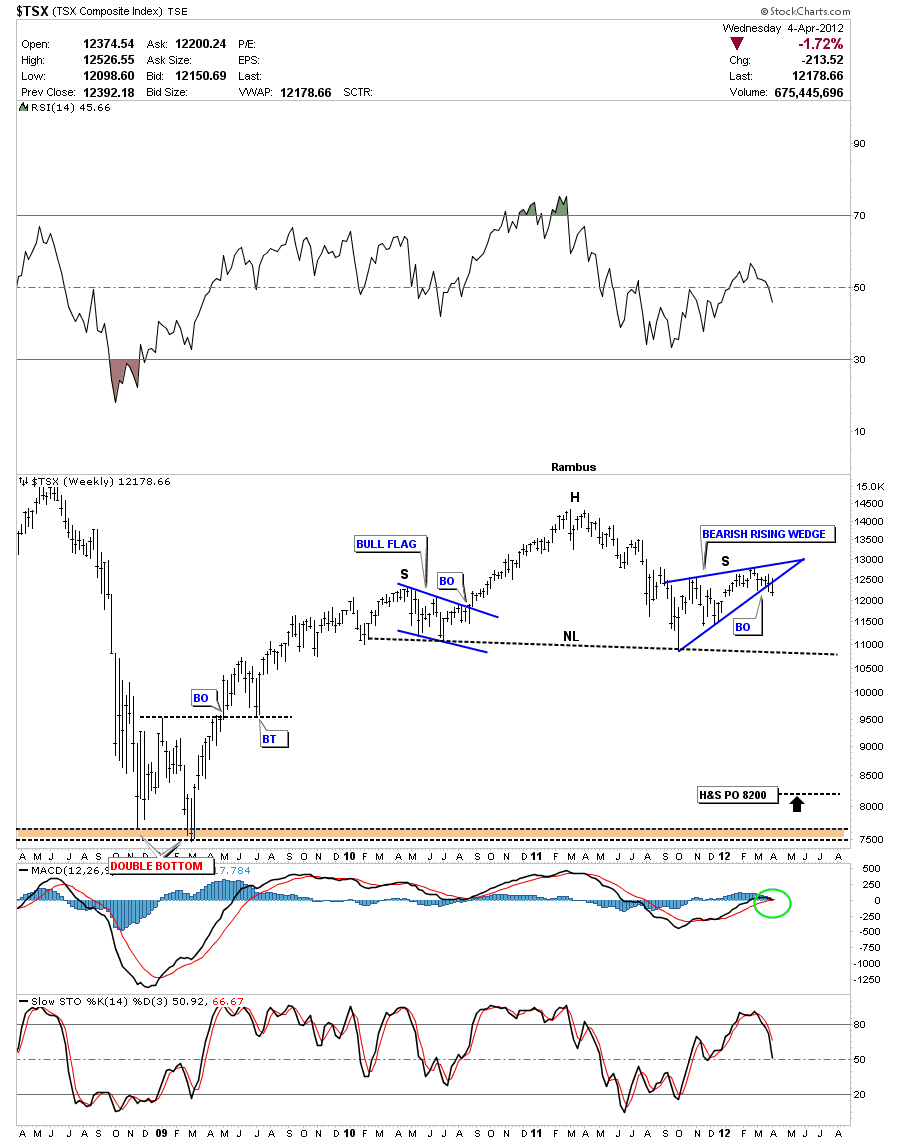
The weekly look at the TSX should make a junior stock investor step back and take notice. The symmetry is very nice with both shoulders having a 4 point consolidation pattern. The left shoulder made a nice bull flag on the way up and the right shoulder has made the bearish rising wedge on the way down. Like so many precious metals stocks I have shown over the last 3 weeks or so this is a big topping pattern that is going to take alot of time to play out to the downside. The H&S price objective measures down to the 8200 area. You can also see the big double bottom that formed at the 2008 crash low that might also come into play.
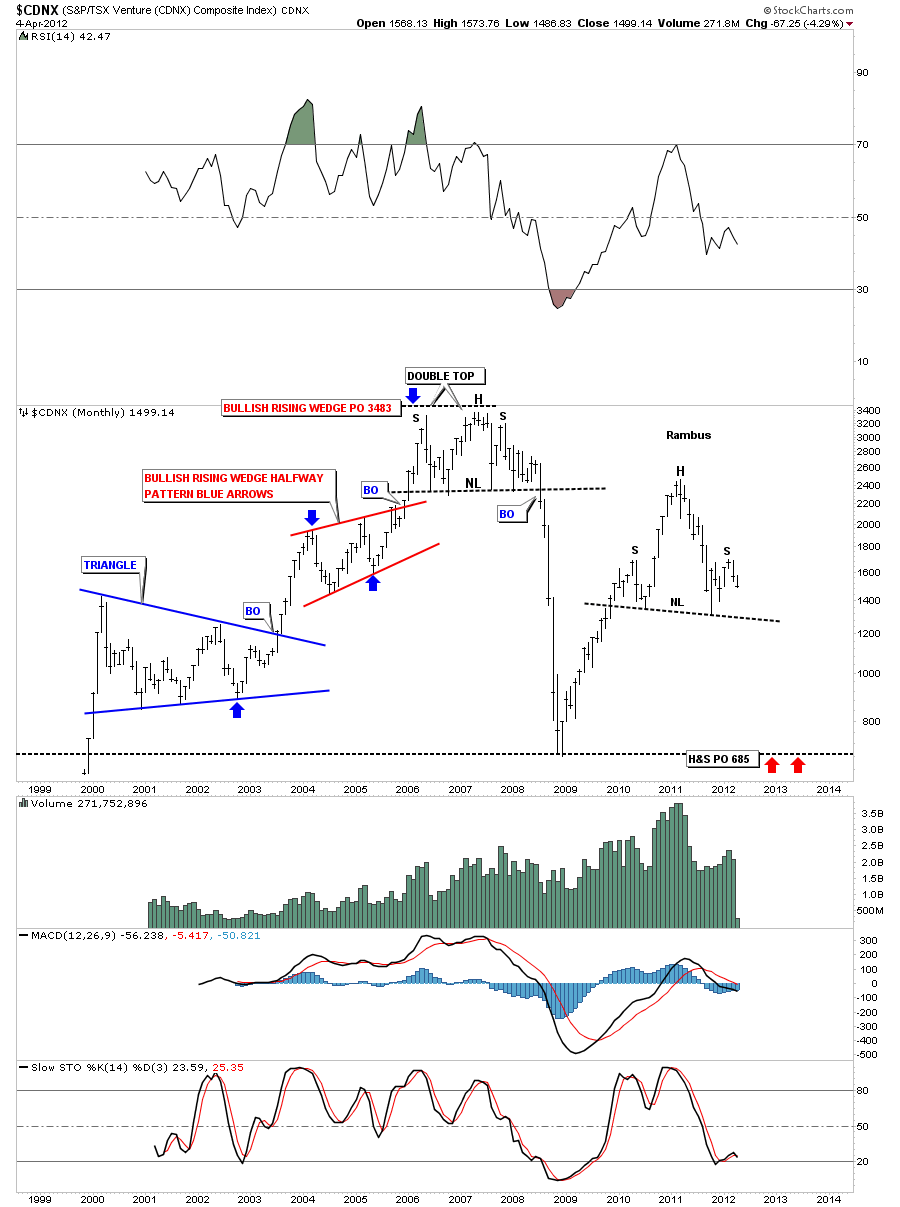
Lets take a long term look at the monthly chart to put the H&S into perspective. As the TSX and the CDNX are very similar looking indexes lets see how the CDNX stacks up. You can see the nice H&S top pattern that is still in the process of building out the right shoulder. What I find interesting about the H&S is the price objective down to the previous bottom made during the 2008 crash, red arrows. Note the previous topping pattern built in 2006 to 2008. I don’t think we will get a crash like we had in 2008 but it could be a more drawn out affair with the same consequences.
Bottom line is this junior small cap index has a very bearish look to it that needs to be monitored very closely. If the neckline gets taken out there will be much more pain to endure if you invest in the junior PM stocks. Thanks DONZI for suggesting this index to look at. I’m glad to see you noticed the big H&S top pattern and the potential it has for investors. These H&S top patterns are all over the place if one decides to look for them….All the best DONZI…..Rambus
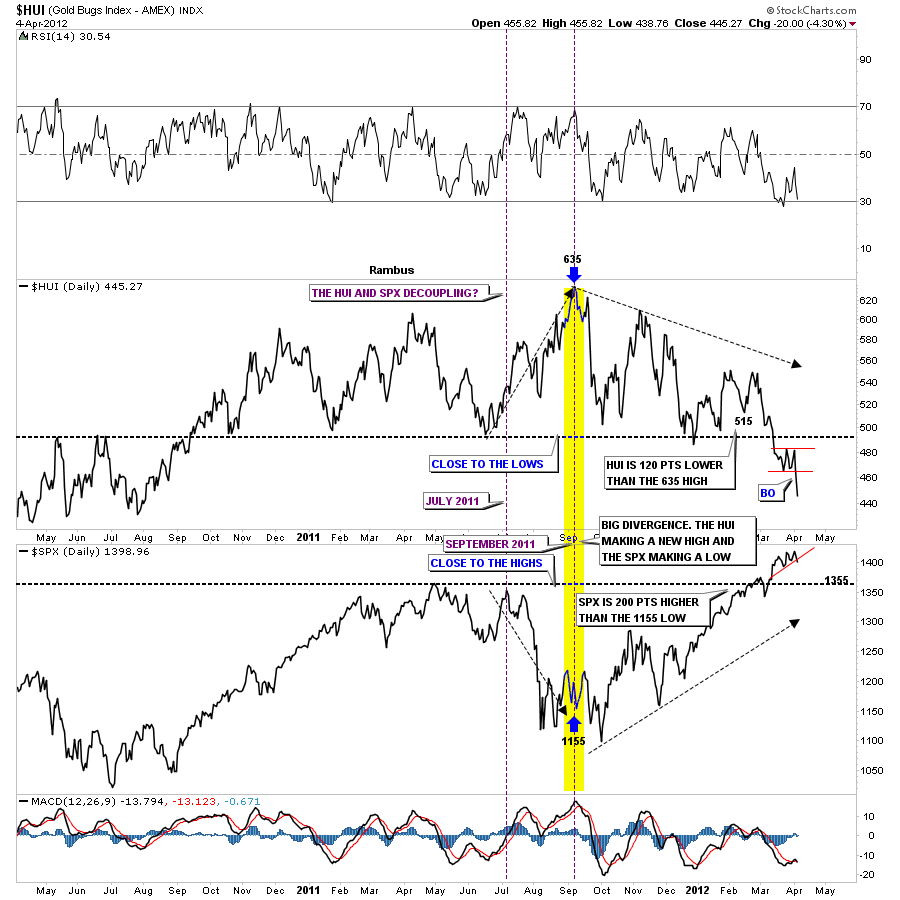
The next question I would like to tackle is from Sir rlscott63 who is wondering if the divergence is still in play between the precious metals stocks and the stock markets as he sees a correction taking place in the stock markets over the next 4 to 5 weeks or so. I think he wants to know if the precious metals stocks are going to go up while the stock markets correct. This first chart shows very clearly how the PM stocks have been diverging from the stock markets for sometime now. As the stock markets have been in rally mode the HUI has been declining. The divergence really started back in July of 2011 when the stock market started it’s big correction. At that time the HUI actually had a nice rally divergence against a falling stock market. That positive divergence to the stock market came to a screeching halt last September when the stock markets were putting in their intermediate term bottom and the HUI was putting in it’s intermediate term top at 635, yellow vertical area on chart below. The two have been negatively diverging with the stock markets making new highs and the HUI putting in new lows. Will this divergence continue is anybodies guess right now but I think if the stock markets do correct in here the HUI will also correct as today clearly showed.
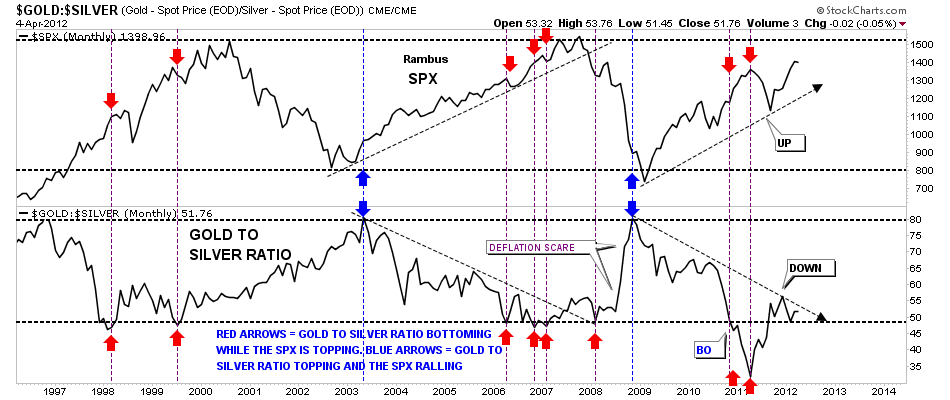
Lets take a look at the gold to silver ratio and compare it to the SPX and see if there is something we can take away to help show the direction of the stock markets vs the gold and silver ratio. The chart below shows the SPX on top and the gold to silver ratio on the bottom. The way this setup works is when the gold to silver ratio is rallying, meaning gold is outperforming silver the ratio rises. And when the ratio is falling silver is outperforming gold. This is an important concept to note. When silver is outperforming gold this is telling the stock markets the economy is improving as silver is still looked at as a commodity. So a strong economy is putting a higher demand on silver than gold causing the ratio to rise. As you can see on the chart below when the stock markets are putting in a major bottom the gold to silver ratio is putting in a major top, blue arrows. In 2011 the gold to silver ratio broke below a very long term support rail as silver was going parabolic and was really outperforming gold. This was the lowest the gold to silver ratio has been in many years. Since silver began it’s correction in April of last year the ratio has been rising along with the stock markets which normally isn’t what one would expect. This maybe just a short term blip as the ratio is still falling and the stock markets are still rising in general.
I hope this answers your question. With so many charts showing H&S top patterns in the pm complex the only way the pm stocks will outperform the stocks markets will be on a short covering rally that will only last a short period of time. I think when the stock markets are really ready to correct the pm stocks will be well on their way to their lows. Like during the 2008 crash low the precious metals stocks bottomed out in late 2008 while the stock markets didn’t find their bottom until March of 2009. I think a similar scenario will appear again when the time is right….All the best rlscott63…Rambus
Another subscriber, eagle, is wondering if there will be a tradeable bounce off the 430 area on the HUI. As the 430 area is where the previous low came in when the HUI was in rally mode off the 2008 low its possible a bounce could take place from that low. First lets look at the most important chart that we have in are arsenal right now and that is the daily 2 1/2 year line chart that is showing the way lower. I’ve drawn a dashed black horizontal line that comes off the bottom of the blue rectangle made in 2010. This is a logical place to see a reversal to take place. Before we go any further I want to make it perfectly clear that this H&S top is a big, very large, huge, gigantic, monster looking reversal pattern. I don’t say this lightly. The implication of that chart will be felt for some time to come. The really baffling thing is that nobody sees it except for the Rambus Chartology subscribers. You have a front row seat to what is taking place right before our very eyes. Please don’t take this H&S top pattern lightly as it could be detrimental to your financial health. At any rate below is the daily line chart that show the 430 bottom off the blue rectangle. The HUI got as low as 439 today before rallying a few point before the close. When you look at the size of that H&S top and our current breakout below the neckline notice how small this move is relative to the top. We are just getting started with this move lower. I can guarantee you we are going to have some counter trend short covering rallies that will knock your socks off and you will think the bear market is over. Nothing will be further from the truth until we get much further along in time and price.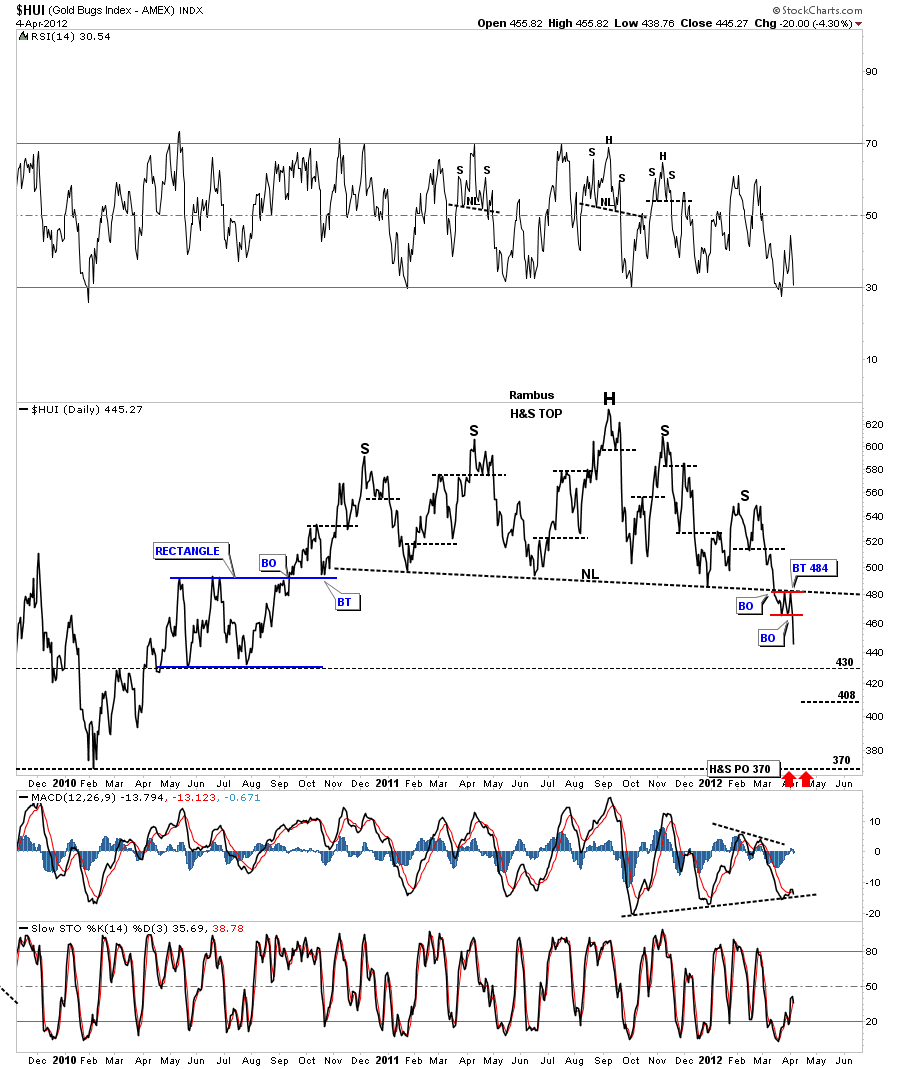
So the question we need to ask ourselves is do we want to trade the counter trend rallies which will be like a salmon swimming upstream? It is always much easier to trade with the major trend whatever direction that is because if you make a mistake the trend will come to your rescue eventually. With the break of the big neckline the new trend is now down compared to the sideways action like the last year and a half have been. I have calculated some price objectives on the HUI, XAU and the GDX that I will post tomorrow as its getting late. I hope I didn’t discourage you eagle but if we are going to trade the counter trend moves we will have to be lightening quick with no room for error. I hope we can do several trades against the trend. If the little red rectangle on the HUI plays out as a halfway pattern then we should be able to spot the low for a counter trend rally and take advantage of it. So lets see what tomorrow brings and let the market do the talking. All the best eagle….Rambus.

