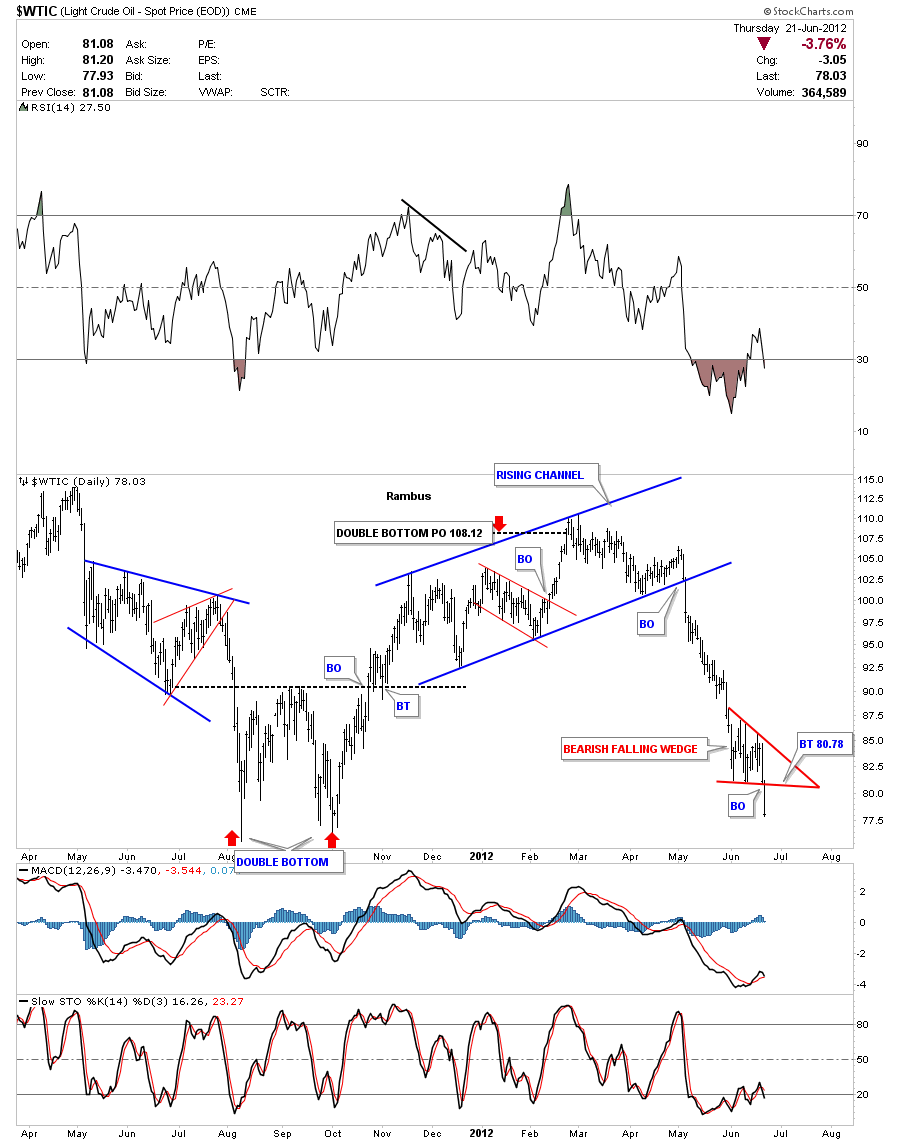
I’ve been showing a potential huge H&S top that has been forming on oil for almost 3 years. Yesterday we had a critical break of the neckline. I first want to show you a daily chart and the bearish falling wedge that broke down yesterday as well. I’ve shown you many instances where a small consolidation pattern, that forms right on an important trendline, will give the bigger pattern the strength it needs to finally confirm the pattern once the last bit of support is gone. Think bear flag on the SLV chart that has formed on the horizontal support rail at 26.. A backtest to the bottom red rail of the bearish falling wedge would come in at 80.78.
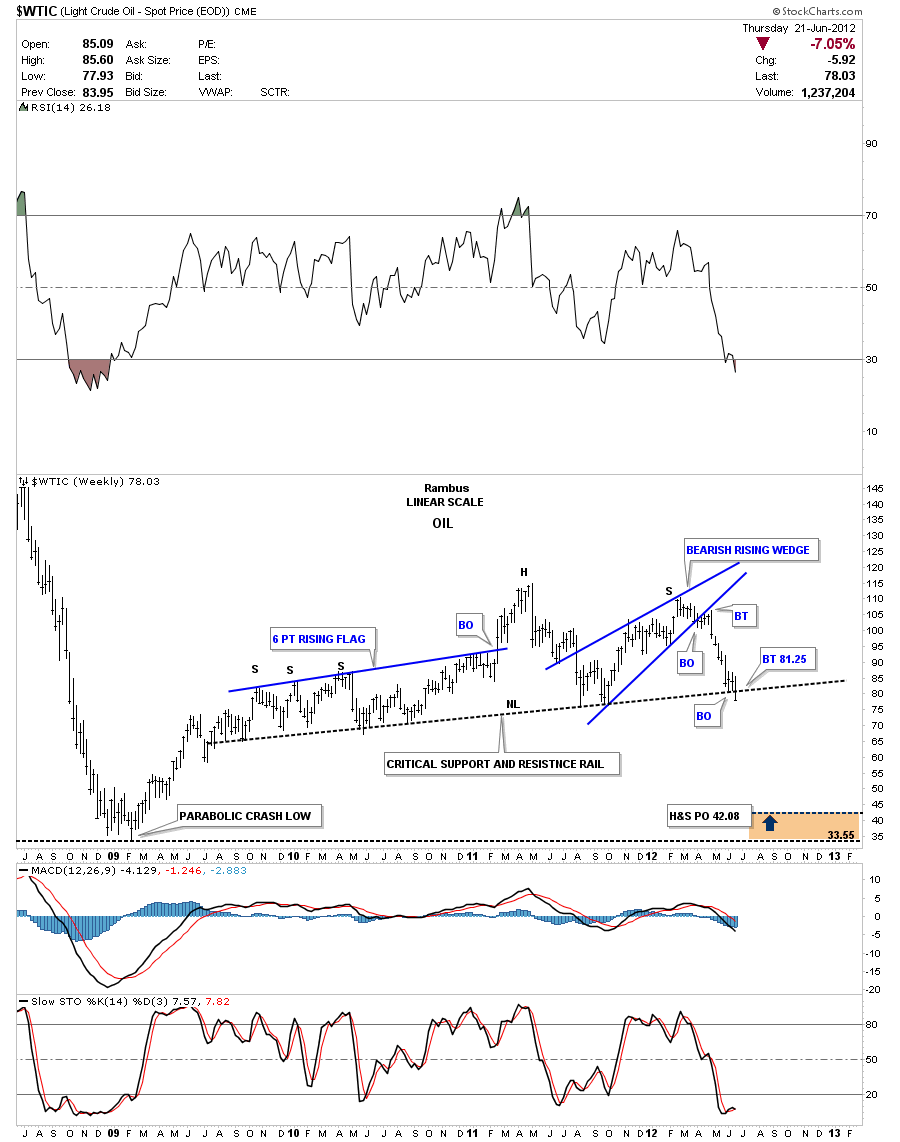
Below is a four year weekly chart that shows the huge H&S top pattern. A backtest to the neckline would come in around 81.25.
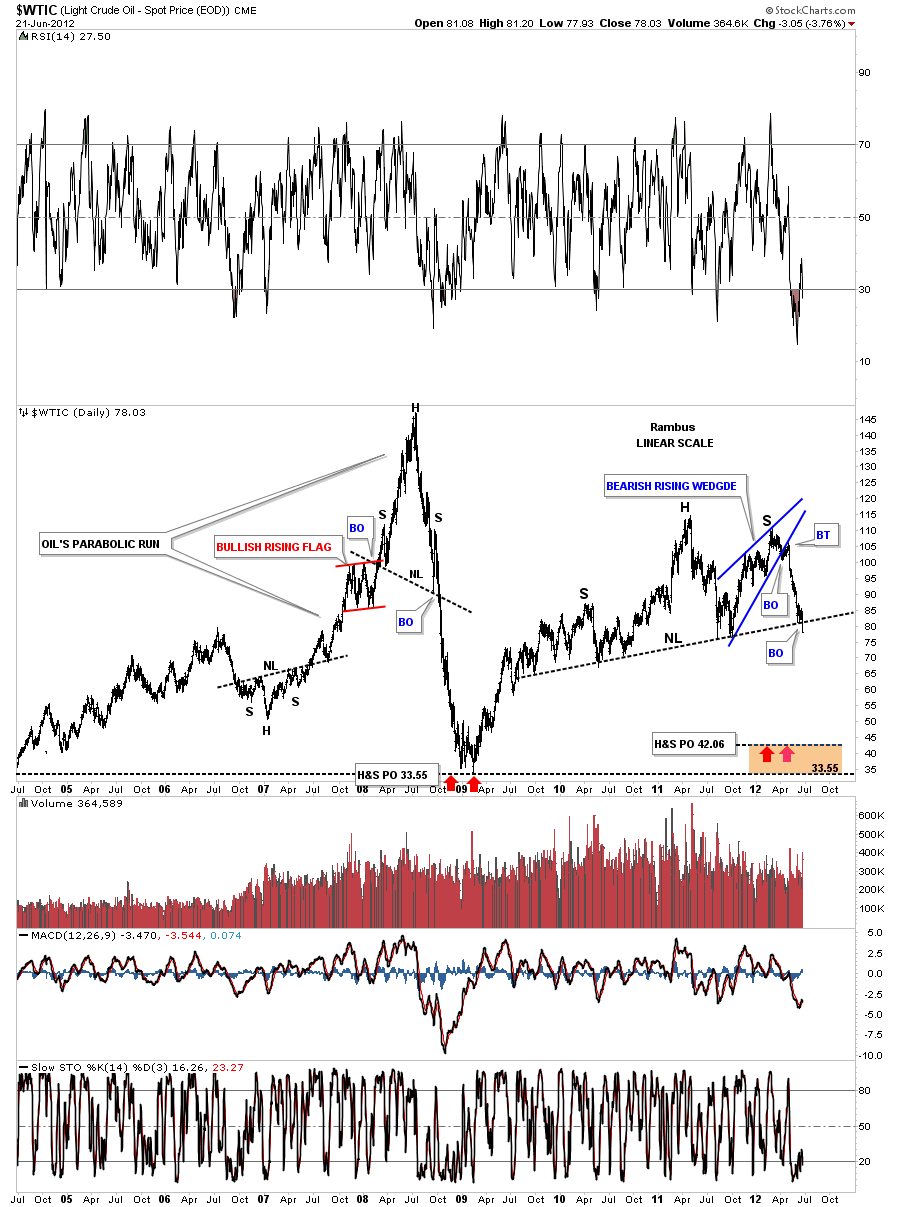
I want to put this H&S top into perspective by showing you an 8 year weekly look that takes in the parabolic rise to 147 and the crash that followed.
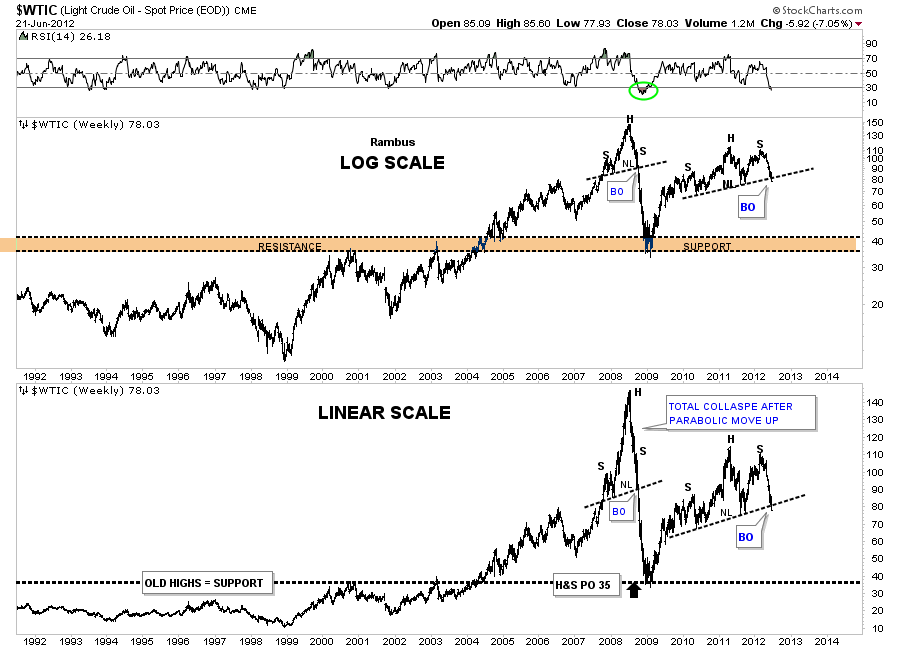
The last chart I want to show you is a 20 year look that shows the old top of the trading range at 35 that kept oil in check until it finally broke through in 2004 that was the very beginnings of the parabolic run to 147. This chart clearly shows that when a parabolic move has run it course the move down can be even faster than the move up. I think this oil chart is giving us a very big clue to the deflation wave that is coming our way.


