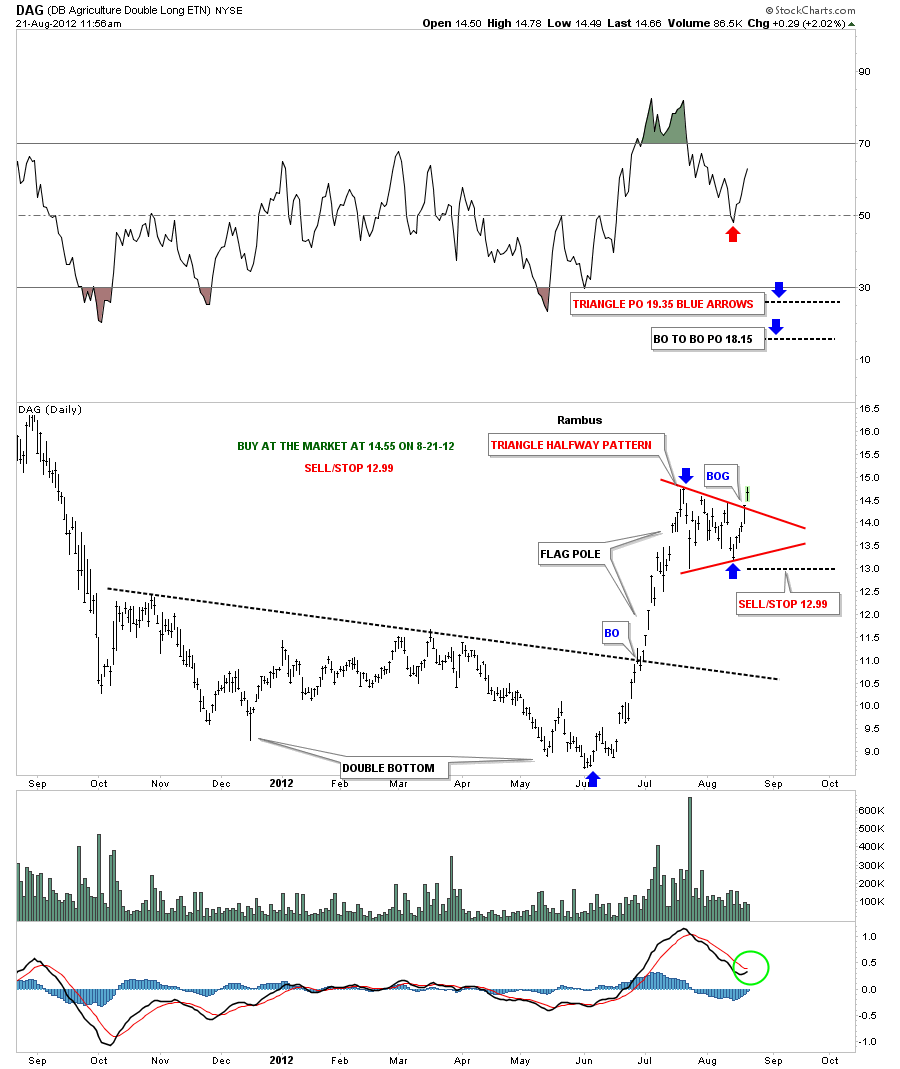
DAG is a 2 X agricultural etf that does a pretty good job tracking the grains. Several weeks ago I showed you this chart of DAG when I wrote about the risk off trade coming back. The red triangle has morphed alittle bit since then but with today’s action it looks like a clean breakout with a nice gap. I’m viewing the red triangle as a halfway pattern. At the top of the chart are two price objectives using two different measuring techniques. Notice the move off the bottom blue arrow to the top of the red triangle. This type of pattern should produce a move equal to the move off the bottom blue arrow at the bottom of the chart to the blue arrow at the top of the red triangle. The near vertical price action is called a flag pole with the red triangle forming at the halfway point. The MACD, at the bottom of the chart is getting ready to crossover and the RSI at the top of the chart has hit 50, red arrow. Alot of times when a stock is in a rally mode, and then has a correction, the RSI will only correct back down to the 50 area that will signal the correction is completing. Instruction on chart below.

