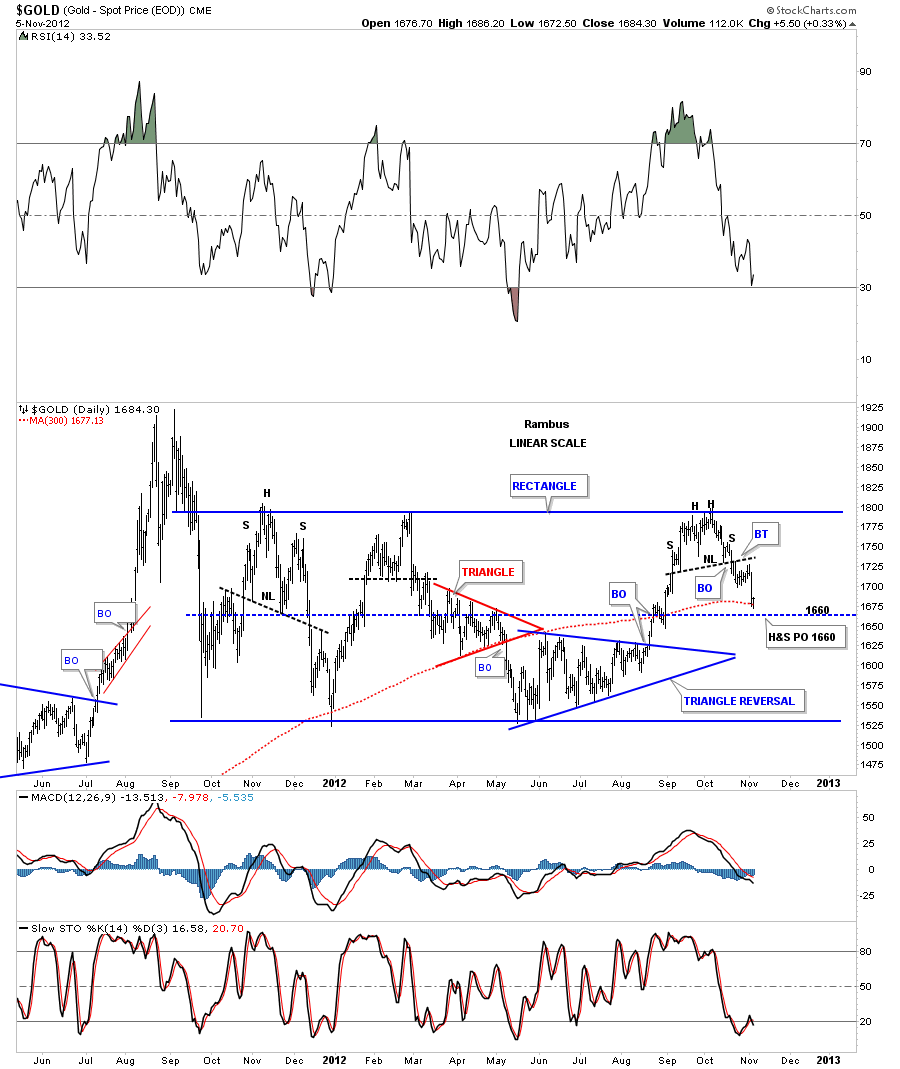
This chart of gold shows you the reason we bought our last shares for the UGLD Kamikaze trade this morning. Keep in mind it doesn’t shows today’s price action. There is the 300 dma that comes in at 1677. The H&S top price objective comes in around the 1660 area that also coincides with center of the big rectangle. The center of a rectangle sometimes acts as support on the last decline before the breakout. That is showing you strength as the last reversal within the rectangle fails to make it all the way back down to the bottom rail. I thought we might make it down to the 1650 area before we found support but today’s action is suggesting the bottom may now be in place. We shall see in the next few days.
Rambus Chartology
Moving forward

