
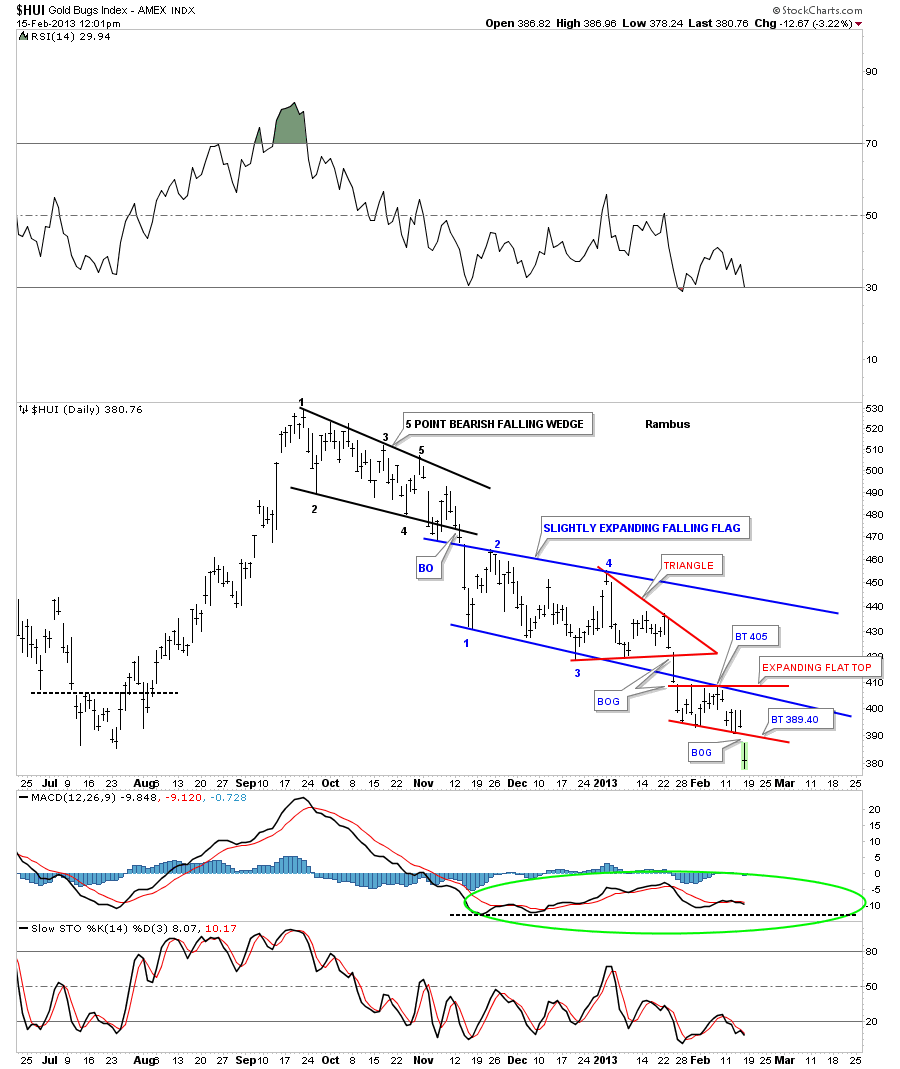
Below is a chart for the HUI that shows all the patterns since this downtrend began at the September 2012 high. Today it broke below the latest small consolidation pattern the little red flat top triangle. Today marks the start of the 3rd impulse leg down since the 2012 top. The first one was the breakout of the black 5 point bearish falling wedge. The second impulse leg down was the breakout of the blue slightly expanding bear flag. And today is the start of the 3rd impulse leg down on the breakout of the red flat top. The reason your seeing a big move is because its a breakout. Notice the breakout gap this morning. This is what one likes to see when you have a completed pattern. It tells you the consolidation period is over. I can guarantee you won’t see this type of analysis or these chart patterns anywhere else on the planet except here at Rambus Chartology.
Editors Note :
I am a HUGE Goldbug…but I decided I can bitch Moan and complain..or…I can follow all the Action
with Chartology by Rambus and be on the right side for a change !
Presently Rambus’s Chartology is showing this may not be even close to Over !
why not join us for some Incredible Tutorials in PM Market Investing
Rambus is giving it to you for free for 10 days but IMHO you may as well subscribe srtaight up
either way you have everything to gain….top right sidebar