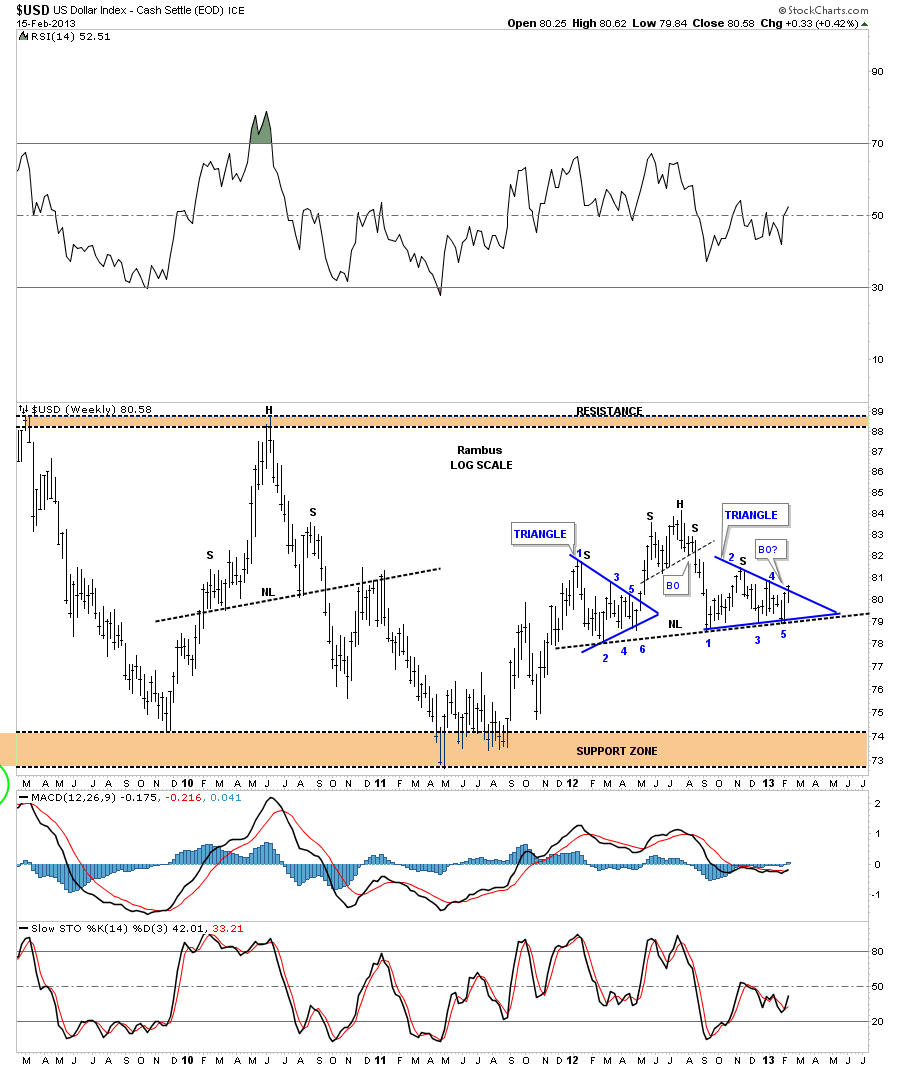
We haven’t looked at the US Dollar in awhile so lets see what it’s been up to in the last month or so. The first chart I would like to show you is a weekly bar chart of the H&S top pattern that everybody is focused in on at the moment. It does have nice symmetry to it and looks like the real deal. Please note the blue 5 point triangle on the right side of the chart where the current price action is strongly testing the top blue rail. As I have shown you many times an odd number of reversal points in a chart pattern equals a reversal pattern. As this triangle is forming below the H&S top we need to see a pattern that has at least 5 reversal points to reverse the downtrend to up. A breakout above the top blue rail will give us our first big clue that the potential H&S top will fail. As you can see the blue triangle on the left side of the head has 6 reversal point making it a consolidation pattern.
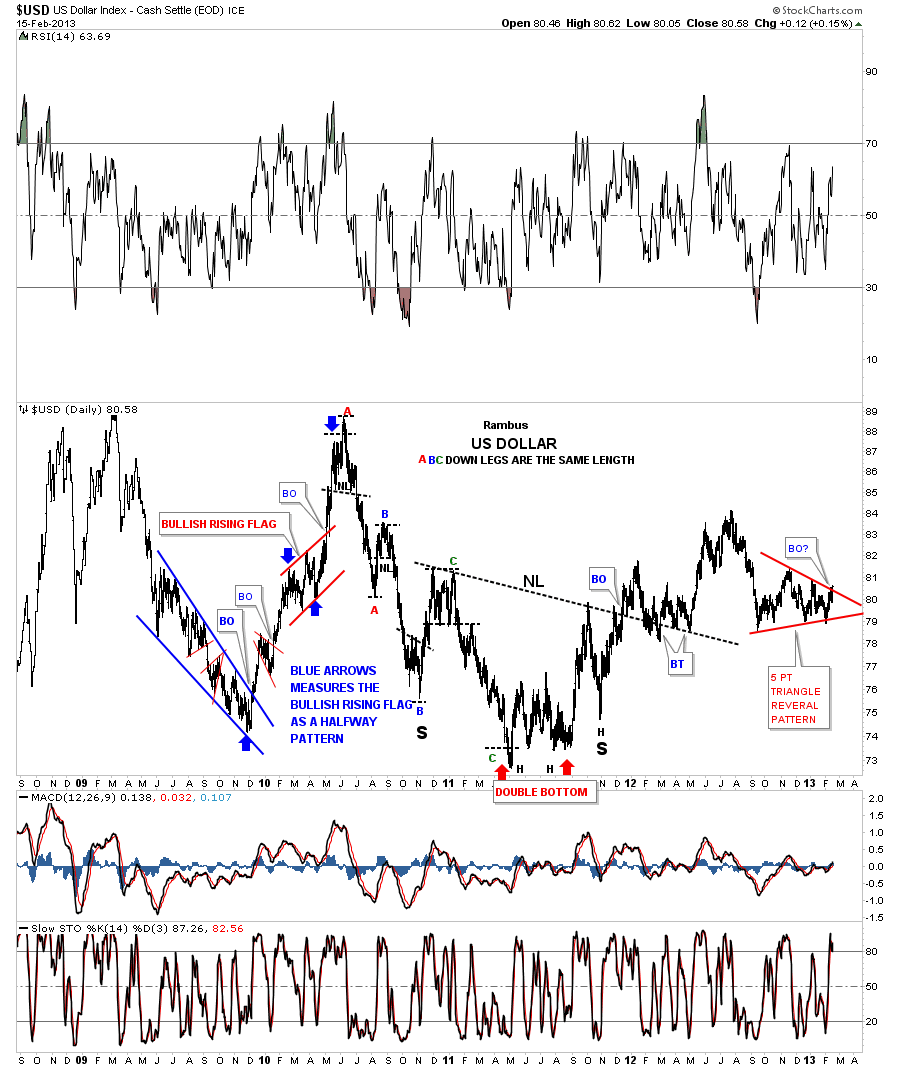
In order to launch a decent bull move a stock has to have a base that gives the stock the energy it needs to make a sustained move. This next 5 year daily chart shows the US Dollar does have a nice big base in which to launch a decent upward move. Some of our earlier subscribers may remember this inverse H&S bottom that we watched develop for sometime last year. As you can see the breakout from the H&S bottom was anything but a rocket launch as the price action has been moving sideways to slightly down. Another simple clue that a bottom could be in is that the dollar has not made a lower low since the backtest to the neckline. A simple clue but an important clue up to this point. Again you can see the price action is strongly testing the top rail of the red triangle.
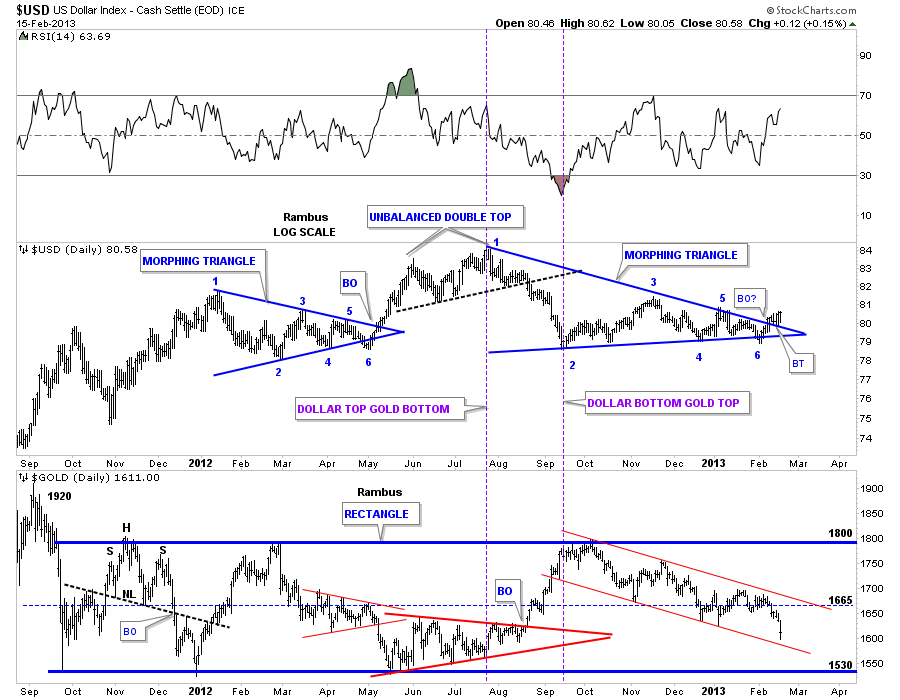
Below is another way we can look at the price action from the Dollar high made back in July of last year. Some of you may recall the blue morphing triangle on the left side of the chart that broke out to the upside after a false breakout to the downside at point #6. We have a similar morphing triangle on the right side of the chart. If we start the triangle from the July top then it only needs to have an even number of reversal point to make it a consolidation pattern. I have to admit its not the prettiest triangle I’ve ever seen but the way the breakout and backtest is progressing it could very well be completing the breakout phase. We will know very soon if this is the case as the top blue rail will have to reverse it’s role and act as support on any pull back. Note the gold chart at the bottom. If the dollar does in fact breaks out of the 6 point triangle to the upside that will put alot of pressure on gold.
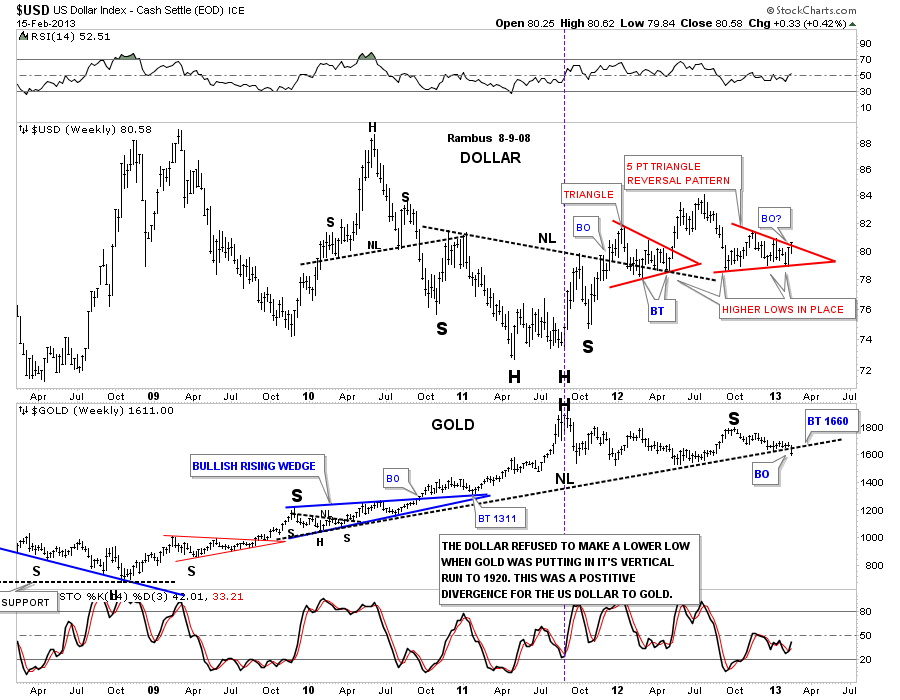
Below is another combo chart that shows the smaller red 5 point triangle reversal pattern on the dollar and the big H&S top pattern on gold on the lower chart. What I find interesting is the last bar on the chart for both the dollar and gold. As you can see the dollar is attempting to breakout from the red triangle and gold broke below it’s big neckline last week. Coincidence?
Lets look at another combo chart for the dollar and gold that goes all the way back to 2003. The US Dollar chart on the bottom is giving a buy signal based on the 20 and 50 week ema’s. As you can see in the red circle, the faster 20 week ema has just crossed over the slower 50 week ema and the price of the US Dollar is above both moving averages at 80.58. You can also see the big long black dashed support and resistance rail that goes all the way back to 2004. That is critical resistance right now but if the dollar ever trades above that S&R rail that will be a very big deal IMHO. As you can see on the top chart gold is in a confirmed rectangle and if the dollar breaks higher that would put serious pressure on gold. Right now it looks like 86 for the dollar is resistance and 1530 is support for gold.
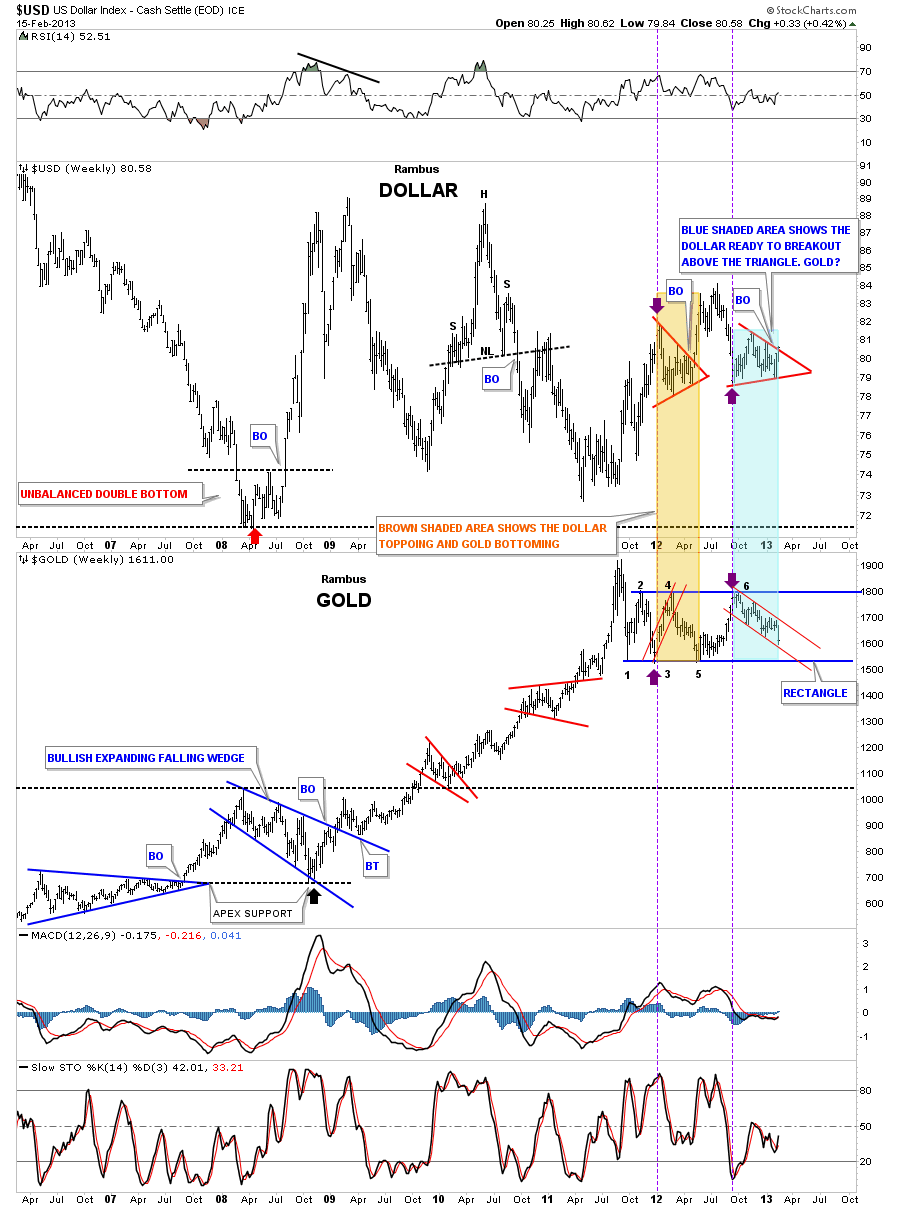
Lets look at one more combo chart for the US dollar and gold. On the chart below I’ve add a brown shaded area and a blue shaded area based on the two red triangles on the dollar chart on top. What this chart shows is the inverse move that the dollar.and gold tend to make. You can see that when the red triangle on the left side was building out gold moved up to point #4 on it’s rectangle and when the dollar finally broke out to the upside gold corrected down to point #5 at the bottom of the rectangle. This is where it gets interesting. Note the red triangle on the right side of the dollar chart that is getting real close to breaking the top rail. If the US dollar breaks out above the red rail that will put serious pressure on gold that will break the bottom red rail of it’s small downtrend channel. And if the dollar has a strong move up the blue bottom rail of gold’s big rectangle will be in jeopardy which would be a serious blow to gold if the bottom blue rail ever gives way. A break of gold’s bottom blue rail of it’s rectangle would then turn from support to resistance on any backtest. So we have plenty to watch over the next week or so. Stay tuned…All the best…Rambus
More (Including Free Trial) at www.rambus1.com

