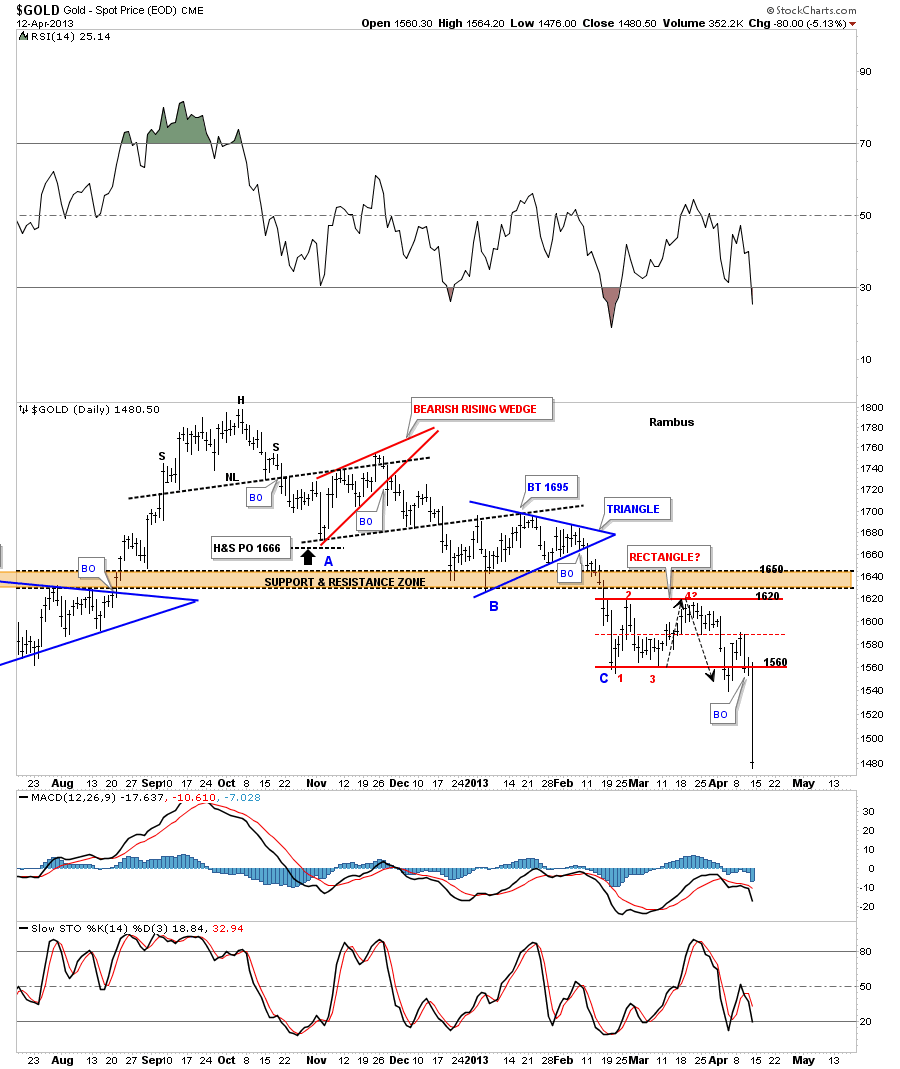
With today’s breakout of the huge 20 month rectangle for gold, tonight would be a good time to take another look, and see what has led up to this important breakout. This first chart is one I posted at the beginning of March when gold was trading at point #3. I put those black arrows on this chart to show you where I thought we should at least get one more reversal up to point #4? that was just below the brown shaded support and resistance zone. Some of you may remember this chart when I was looking for the 1620 area for a possible 4th reversal point. Sometimes the last reversal point in a rectangle will hit the middle of the rectangle before the actual breakout begins, red horizontal trendline As you can see this was the case this week.
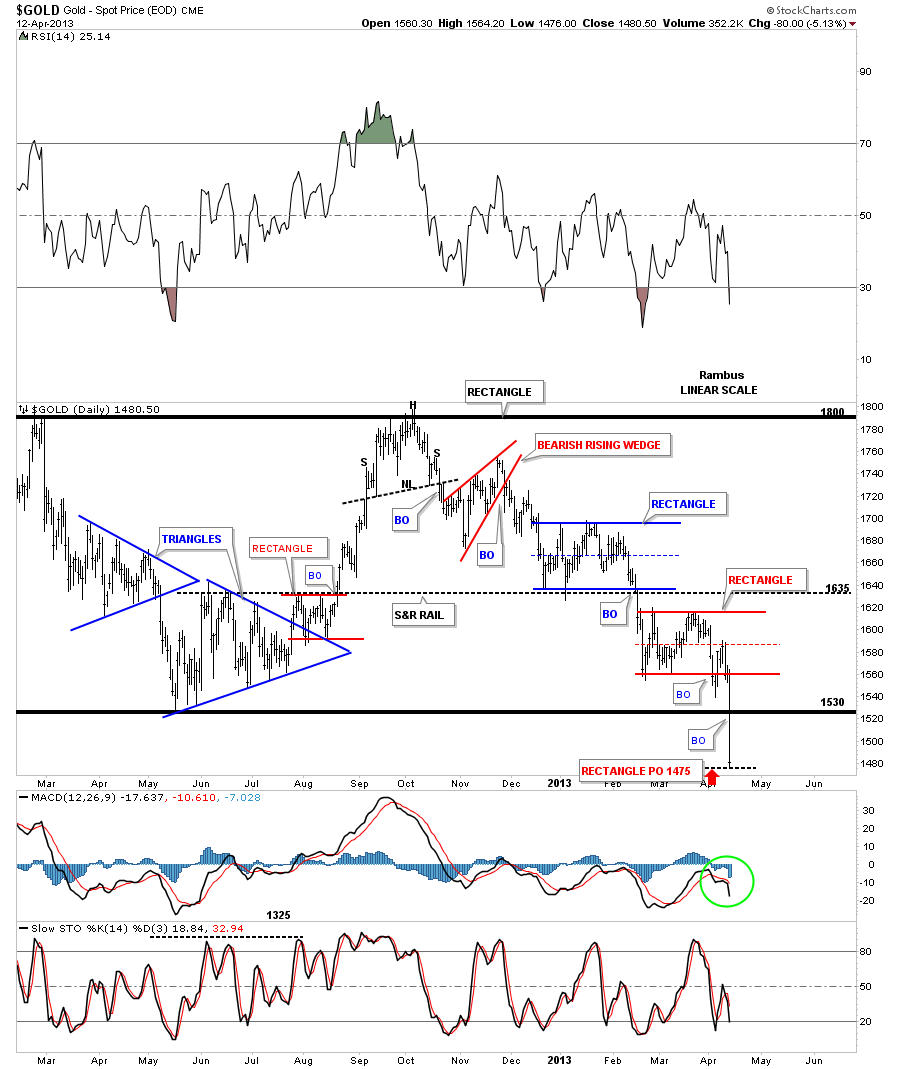
This next chart is a longer term daily look that shows all the consolidation patterns that have formed since the last high at 1800. Today’s price action shows a classic breakout of a major chart pattern, the 20 month rectangle. The red rectangle had a measured move down to 1475 which we hit today. That last red rectangle strongly suggested that the breakout of the big 20 month rectangle was going to happen because the price objective of the red rectangle was roughly 50 points below the bottom rail of the 20 month rectangle. It should not surprise you if we now get a backtest to the underside of the big rectangle at 1530 before the price moves lower. Possible but no guarantee.
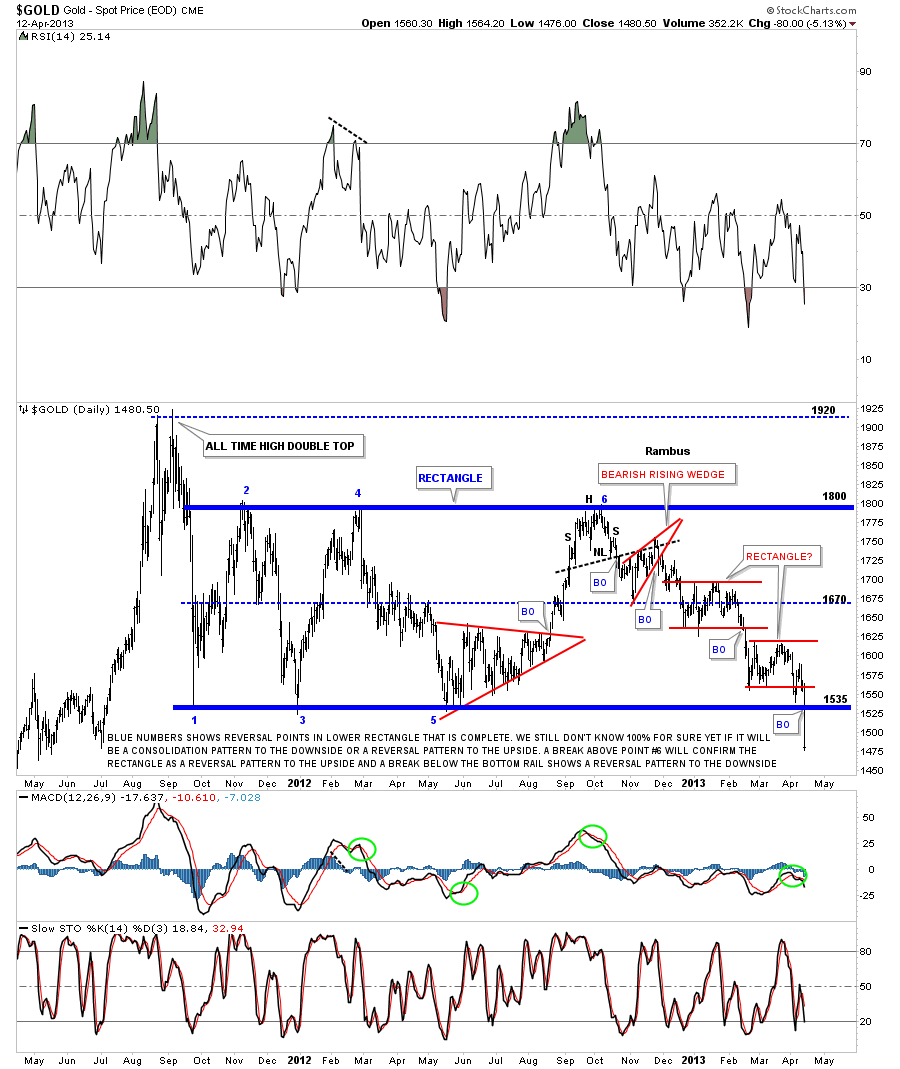
We finally got our answer to the question asked from the chart below.
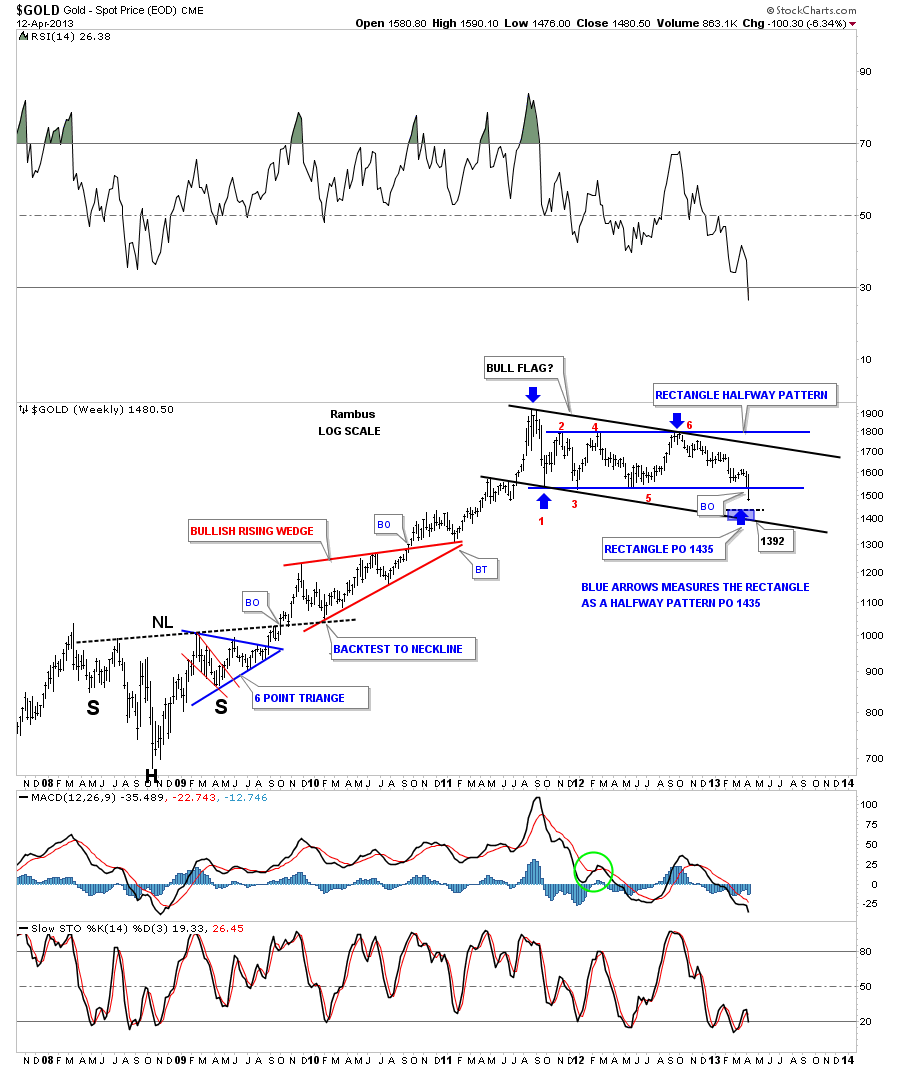
This last chart shows the best case scenario for gold. If the 20 month rectangle is a halfway pattern then the price objective would come in around the 1392 to 1435 area. This is just one scenario of several scenarios that are in the play book right now. Stay tuned as today marks a potential turning point for gold. All the best…Rambus