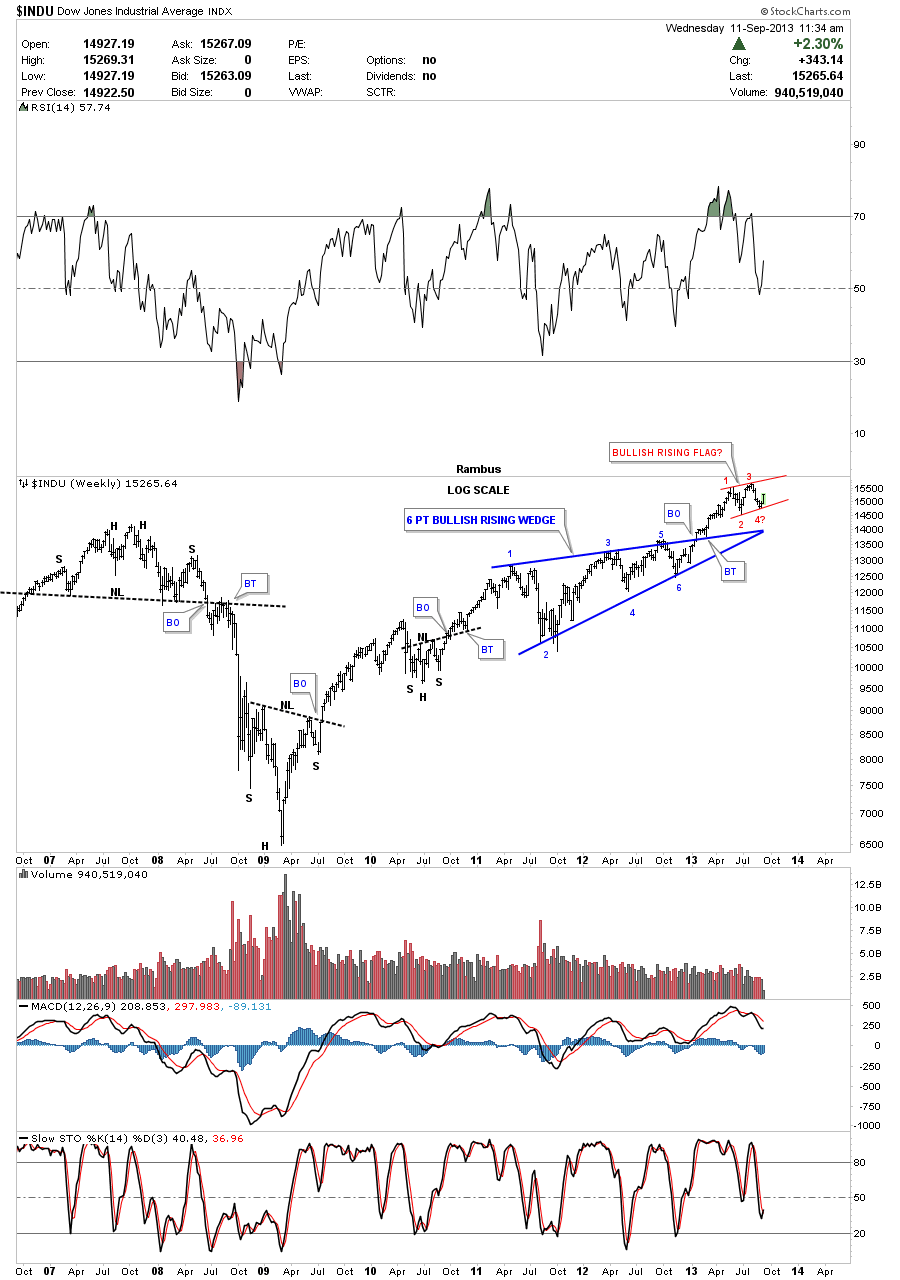
Its been awhile since I showed you an updated chart for the Dow. As this long term weekly chart below shows everything is still moving along according to the game plan I’ve laid out. I’ve shown you many of these bullish rising wedges that appear on some of the major stock market indexes that have all broken out to the upside. These bullish rising wedges confuse a lot of trades as they see them as always being bearish. My interpretation of these types of patterns, that form in the same direction as the trend, tend to be very bullish as it suggests that investors are anxious to get in and aren’t waiting around for lower prices. Some may call these types of patterns running corrections. As you can see the Dow is possibly forming a smaller red bullish rising flag, which again shows investors aren’t waiting around for lower prices. We have just started the 4th reversal point to the upside. A breakout above the top red rail will signal the bullish rising flag is complete which I would then view as a halfway pattern. There are two ways I measure a halfway pattern. The first way is to measure from the breakout of the lower pattern to the first reversal point in the upper pattern, labeled reversal point #1 and add that measurement to the breakout of the upper pattern to get your price objective. The second way I measure a halfway pattern is to measure the impulse leg up that starts at the last reversal point in the lower consolidation, in this case reversal point #6 to the first reversal point in the upper consolidation. You are measuring the the first impulse leg. Again take that measurement and add it to the last reversal point in the red bullish rising flag to get your price objective. Many times these two methods will be very close in price to each other. If this possible red bullish rising flag plays out as expected it will look like it formed about the halfway point when the top measured move is reached. Note the beautiful H&S patterns that reversed both the uptrend and the downtrend and the one that was a consolidation pattern. This chart shows, by following the price action, and not trying to second guess every little wiggle that is made, one will always find they are aligned with the trend either up or down in the big picture.