
Today’s price action gave us a very important clue that a major shift is brewing in regards to the precious metals complex and most likely commodities as well. These kinds of days don’t come around very often but when you see such a massive move during the day time trading hours you need to pay attention. I know today’s price action may be very frustrating for some of you but It’s all part of the game we choose to play. It’s days like today that separate the winners from the losers. This is the point where many will throw up their hands and say ” I quit this is just to hard.” But in all honesty this is the point where you can grow as an investor because you have survived one of the best shots the markets can throw at you. Now it’s all about analyzing what happened today and moving forward.
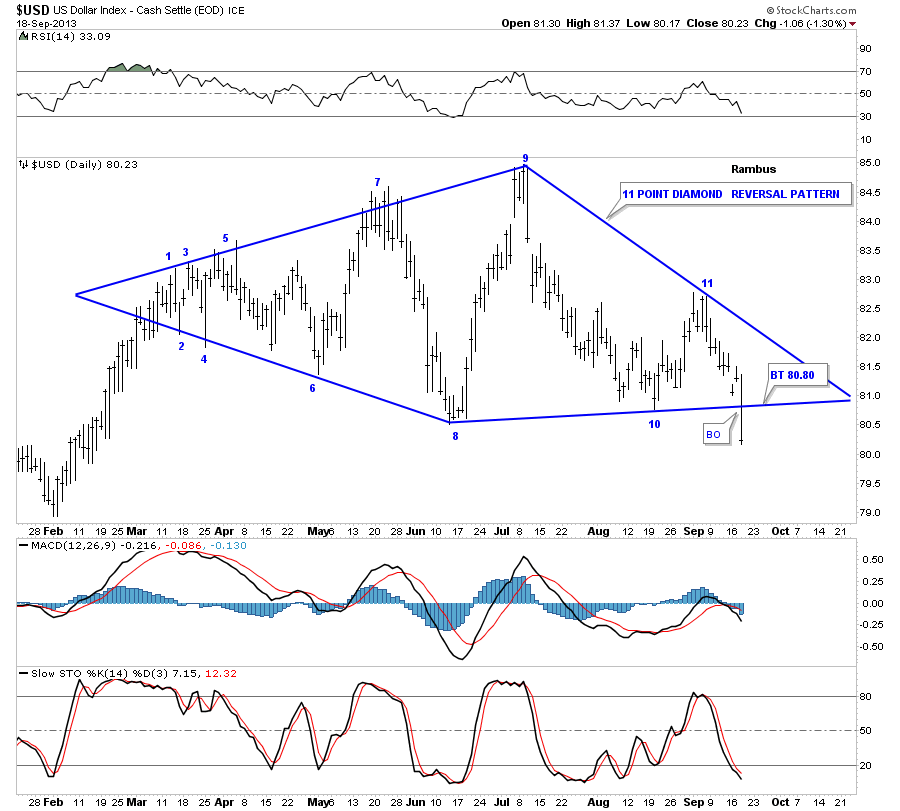
Today we got the biggest clue we could ask for. The almighty dollar finally gave us the answer we’ve been waiting for. As you know I’ve been bullish on the dollar for quite sometime waiting for it to show its hand. Today was the day. Early on in its development I showed the potential for a Diamond pattern that I believed would breakout to the upside. Today we got the breakout but it was to the downside. I always talk about the number of reversal points a pattern makes because it can tell us if it’s going to be a consolidation pattern or a reversal pattern. An even number of reversal points equals a consolidation pattern that will breakout in the direction of the move leading into the consolidation pattern. An odd number of reversal points tells us the congestion area is going to be a reversal pattern. As you can see on the chart below the Diamond has 11 reversal points making it a reversal pattern to the downside. Also note the big long daily bar today. This is what a breakout looks like. Today’s breakout move in the US dollar is a pivotal event that is going to change things at least for the intermediate term. After all these months of waiting for the dollar to finally show its hand today was the day. It’s now possible we could see a backtest to the underside of the blue diamond around the 80.80 area before it moves down in earnest.
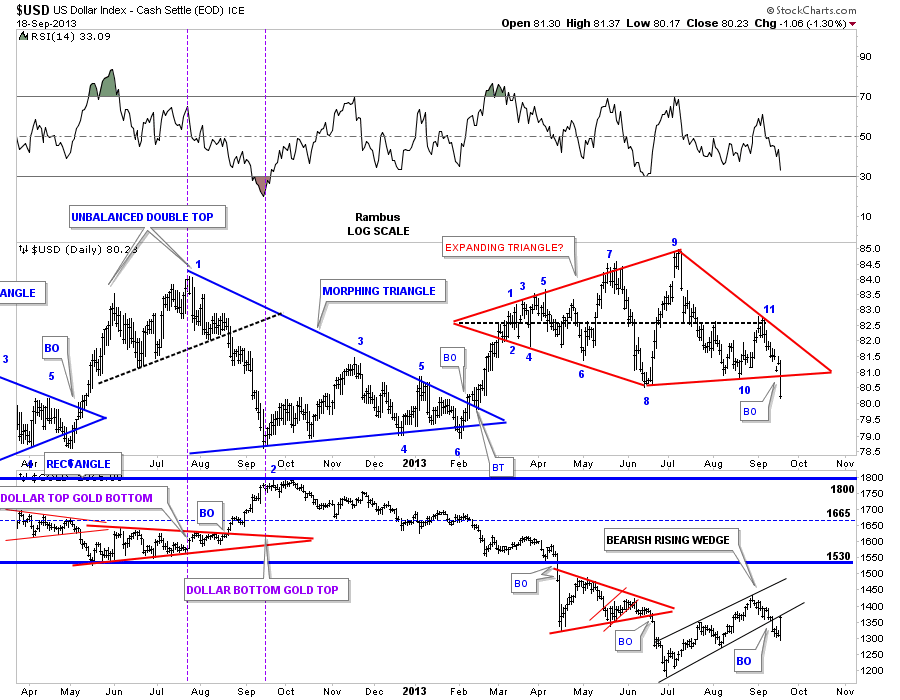
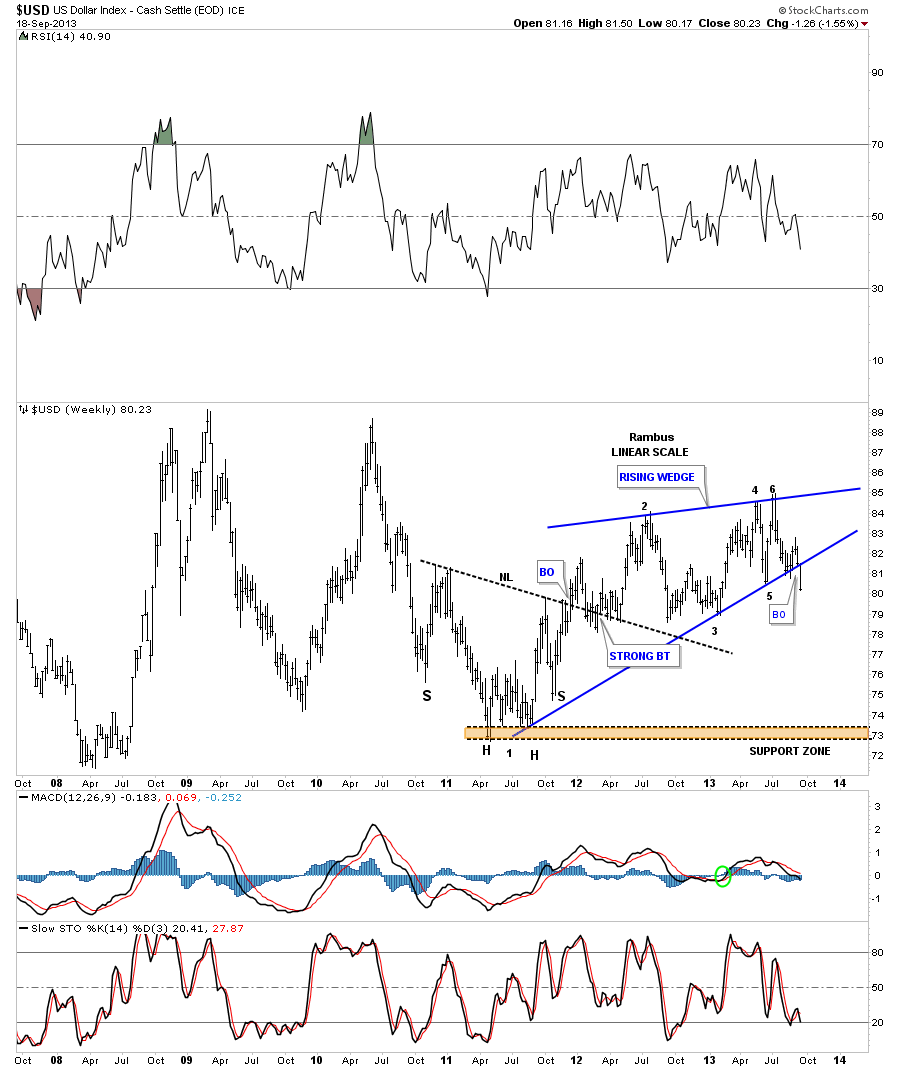
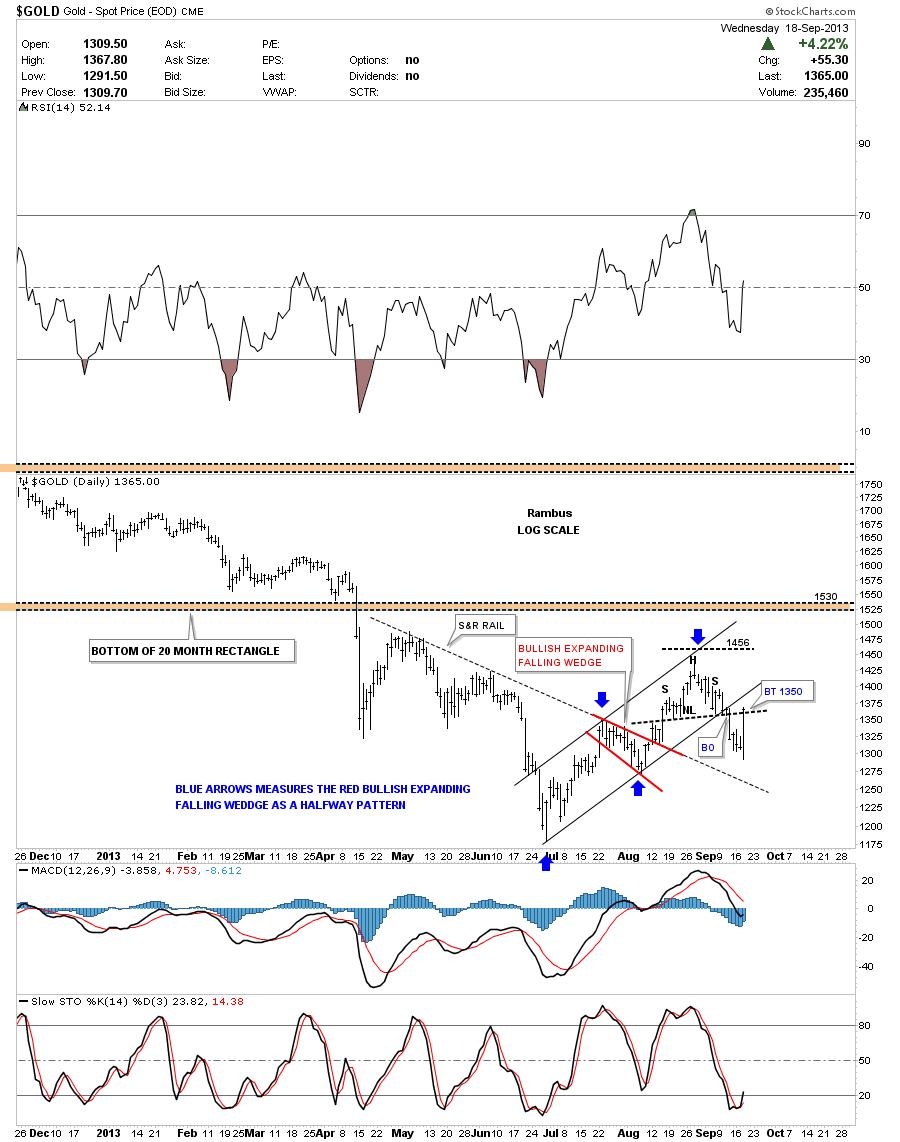
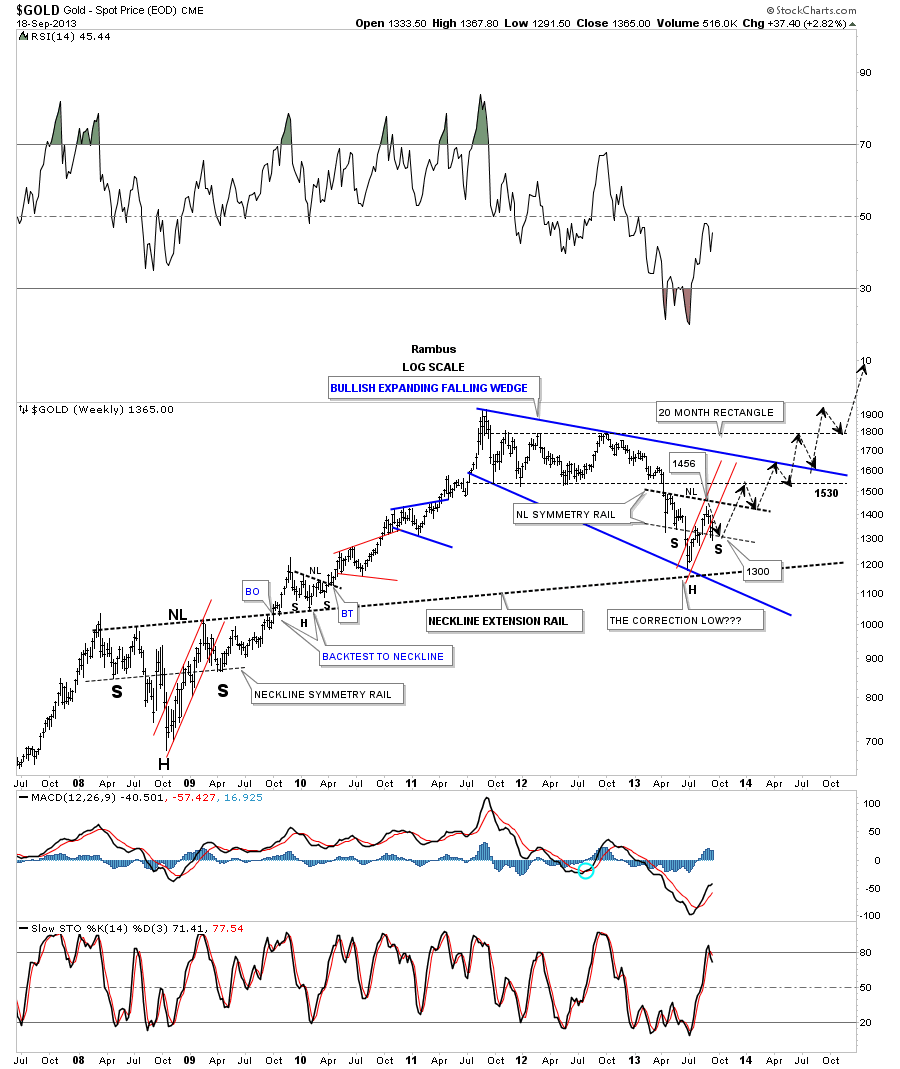
The breakout in the dollar gives us perspective of where we are in the scheme of things which is important to know. This next chart is a combo chart that has the US dollar on top and gold on the bottom. If you recall our diamond pattern originally started out a an expanding triangle, reversal points one through nine. The gold chart shows it backtesting the bottom rail of the rising wedge pattern which so far is holding resistance. If gold can manage to close above that bottom rail that would be another very big clue that gold has some legs and could rally further. The bottom blue rail of the 20 month rectangle, at 1530, is by far the strongest resistance point that gold will have to overcome to really start a new major leg higher.
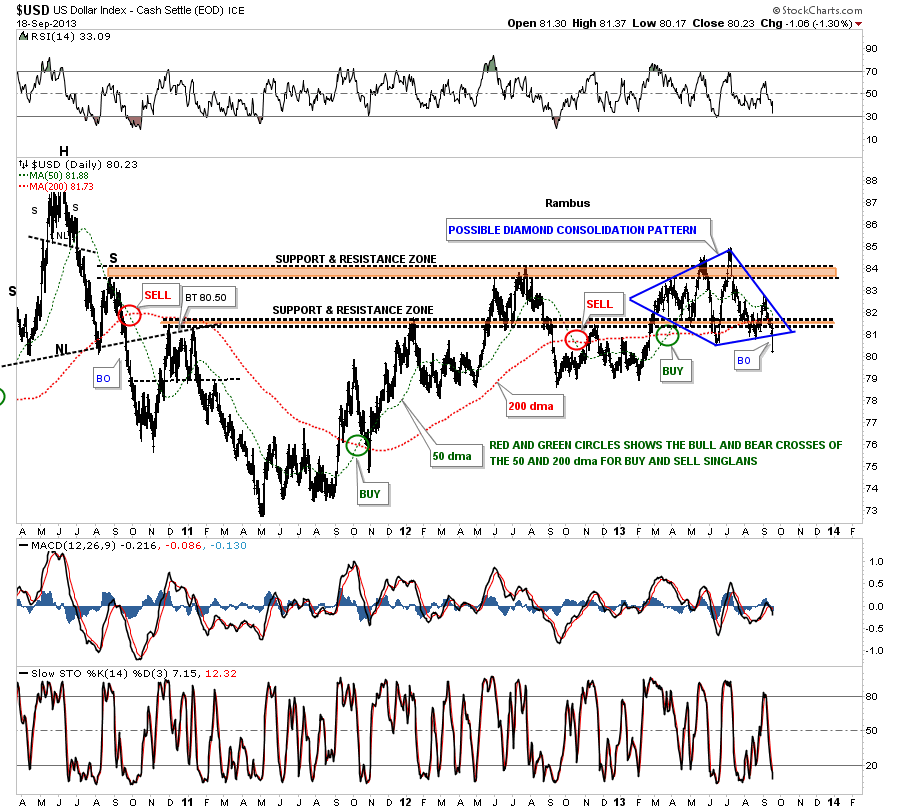
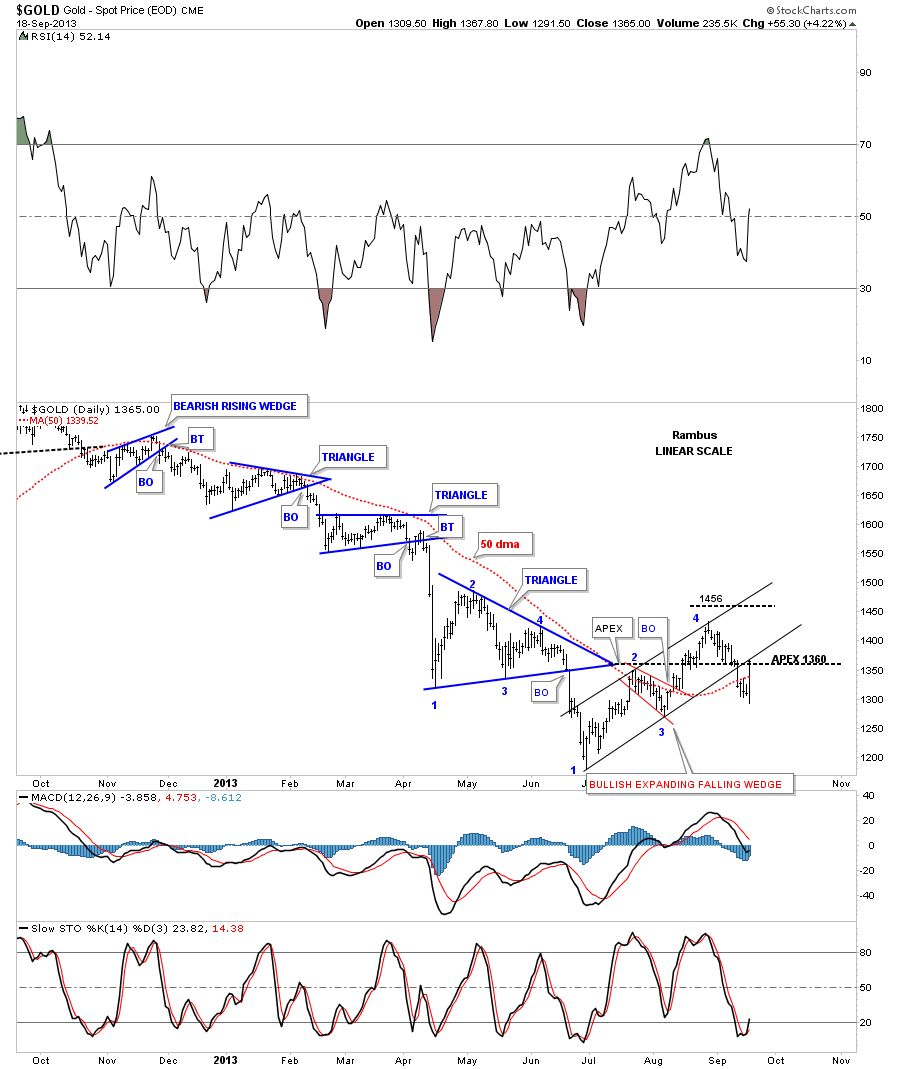
The blue diamond on the longer term look with the 50 and 200 dma crossovers. So far the 50 dma hasn’t crossed below the 200 dma yet but it’s now getting close.
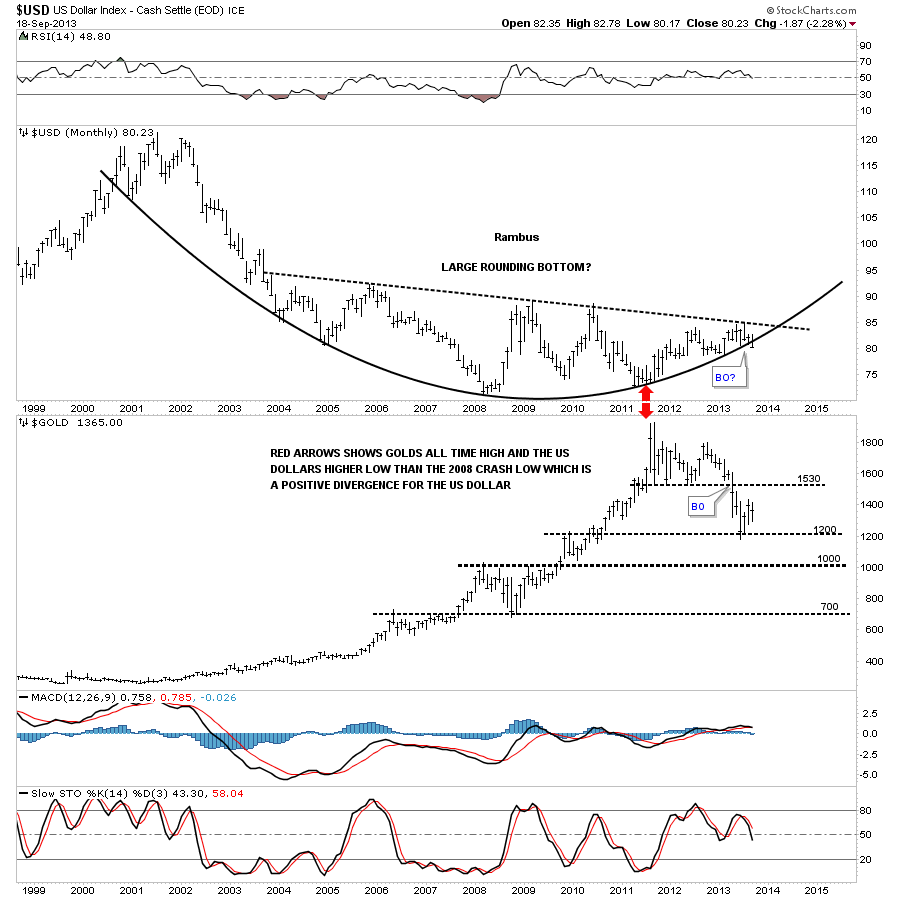
This next long term combo chart for the US dollar and gold shows the dollar breaking below the rounding bottom that has been in place for many years. This is a big deal. Again you can see how the 1530 area shows up as resistance for gold.
Let me show you one more chart for the US dollar that I don’t believe I’ve shown you before. As this rising wedge formed below the previous top it only needed an even number of reversal points to be a consolidation pattern. As you can see it clearly broke below the bottom rail today signaling the rising wedge is a bearish rising wedge. The price objective of a rising wedge, when it has broken to the downside, is where the rising wedge first started to form. In this case the low around the 73 area would be the price objective.
Below is a daily gold chart that looked very negative up until 1 pm today. Now I would have to rate it as neutral until it can trade above the neckline and the bottom rail of the rising wedge.
Lets take a look at gold that shows the rally today stopped right at our overhead resistance at the 1360 area. A move back inside the rising flag would be constructive.
About a month ago we tried our hand at going long the precious metals sector for the third time in the last year or so. We loaded up on a bunch of precious metals stocks and the long 3 X gold and silver eft’s. Below is the original chart I posted at the time that showed how a possible inverse H&S may form based on the Chartology of the chart. I have not touched this chart since I posted it in the, “Another Brick in the Wall post”.
Today’s price action bounce off of the 1300 area which was critical for this potential scenario to play out. It looked like earlier this morning that gold was cracking the bottom neckline symmetry rail. By 1:15 it was obvious that the 1300 held as support. As you can see gold is now trading right into overhead resistance backtesting the bottom rail of the uptrend channel. I need to tweak the neckline down just a tad as gold failed to reach my price objective up to the 1455 area. I will also have to tweak the neckline symmetry rail just a tad as it runs parallel to the neckline.
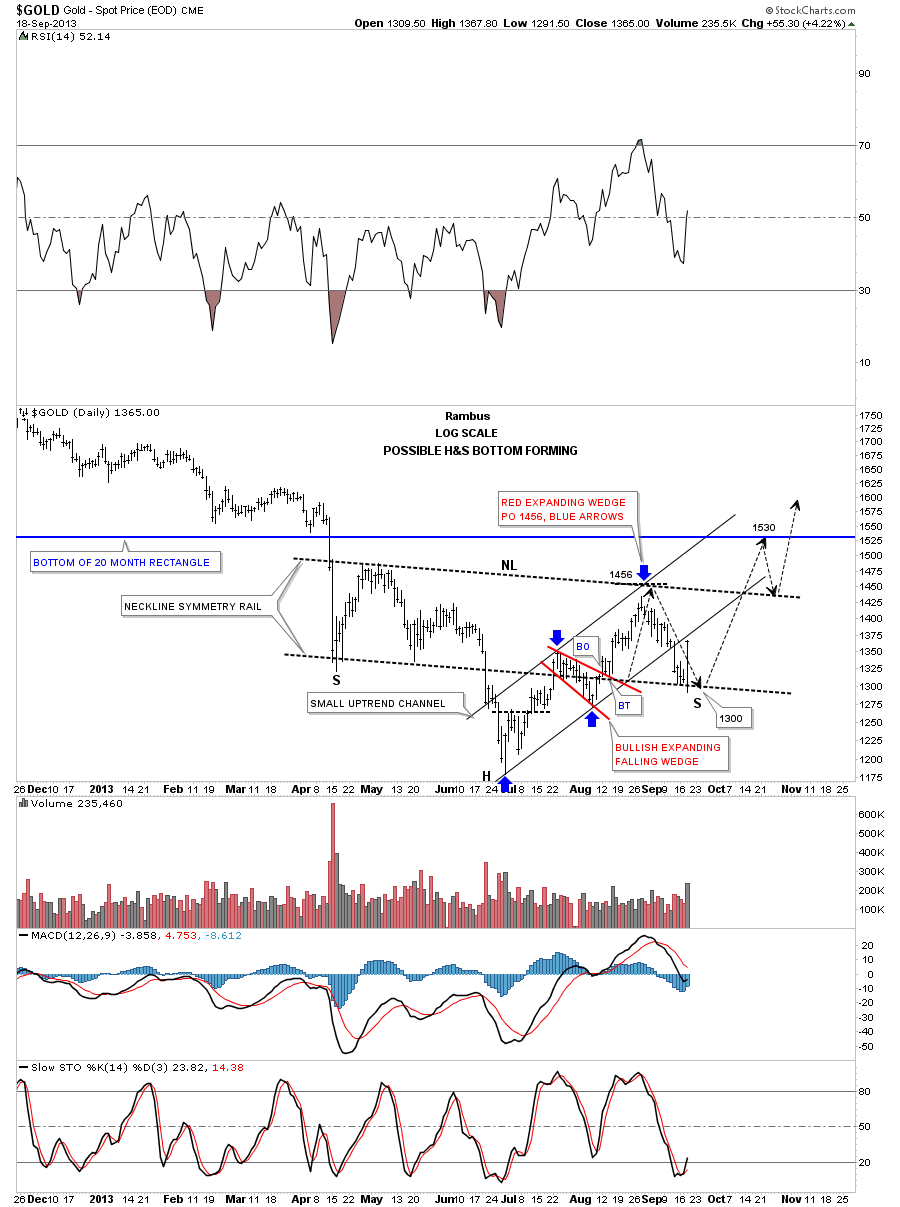
Below is a weekly chart that shows the potential inverse H&S bottom that still has alot of work to do yet before we can say it’s complete. Today’s bounce at 1300 goes along way in the development of the possible H&S bottom.
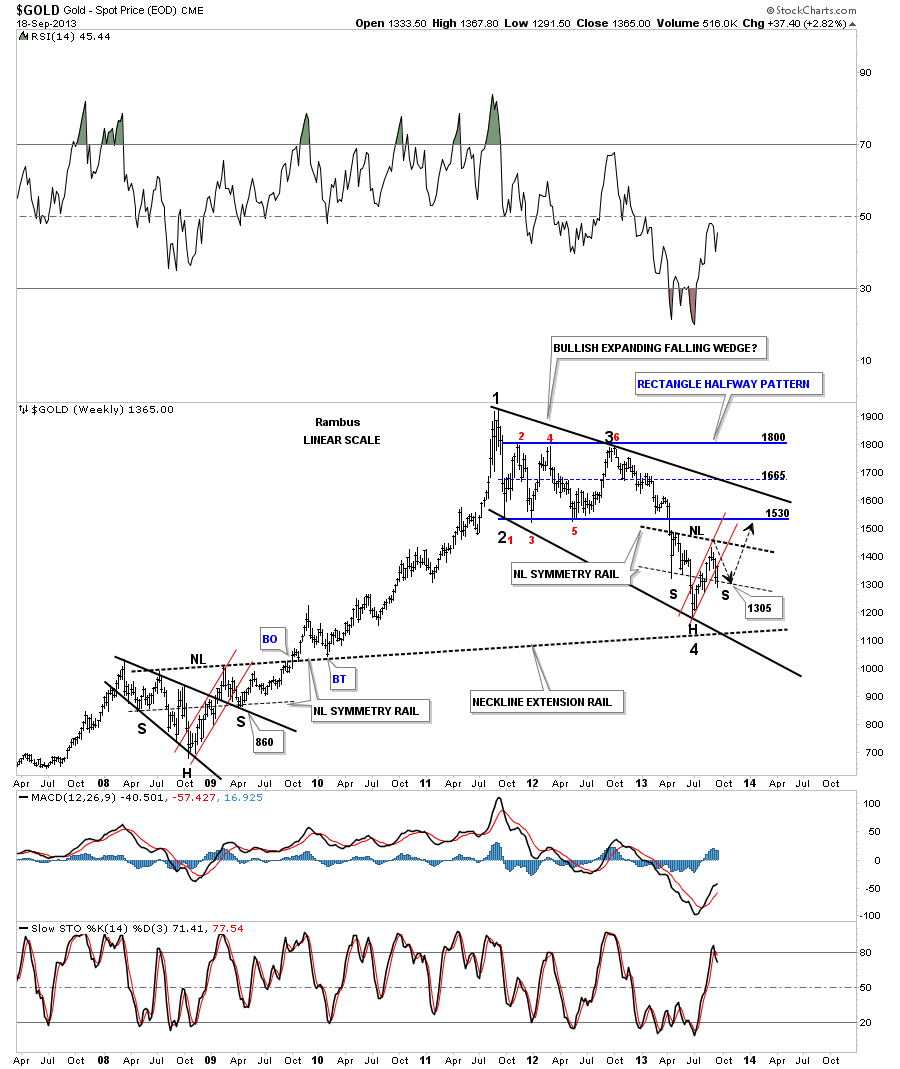
Based on the long term look at where support and resistance resides I built this chart that shows how gold could move higher. This would be a perfect scenario chart where gold would hit overhead resistance, fall back to support, rally back up to the next resistance rail, backing filling all the way up. Gold has a lot of work to do but if the June low is THE LOW this is how I would expect it to move. Once gold can trade above the top blue rail of the bullish expanding falling wedge that is when gold will be in the clear and can run to new highs. Right now gold is trading right in the middle of the possible bullish expanding falling wedge consolidation pattern.
Tomorrow we’ll look at the precious metals stocks and indexes. Today’s price action came right at the last critical moment to preserve some of the inverse H&S bases that had been forming since April in some cases. They aren’t some of the prettiest bases I’ve ever seen but they could fit the bill with just a little more work to the upside. Keep in mind that the precious metals complex is still consolidating or bottoming and today’s price action is very miniscule when one looks at the longer term monthly chart. Bases take time to build and I would like nothing better than for the precious metals stocks to be forming long lasting bottoms in here. We just have to follow the price action and see where it leads us. We should know more in the next few days if some of these bases are really going to mature and some sort of bottom is in place if even for the intermediate term. Stay strong…Rambus