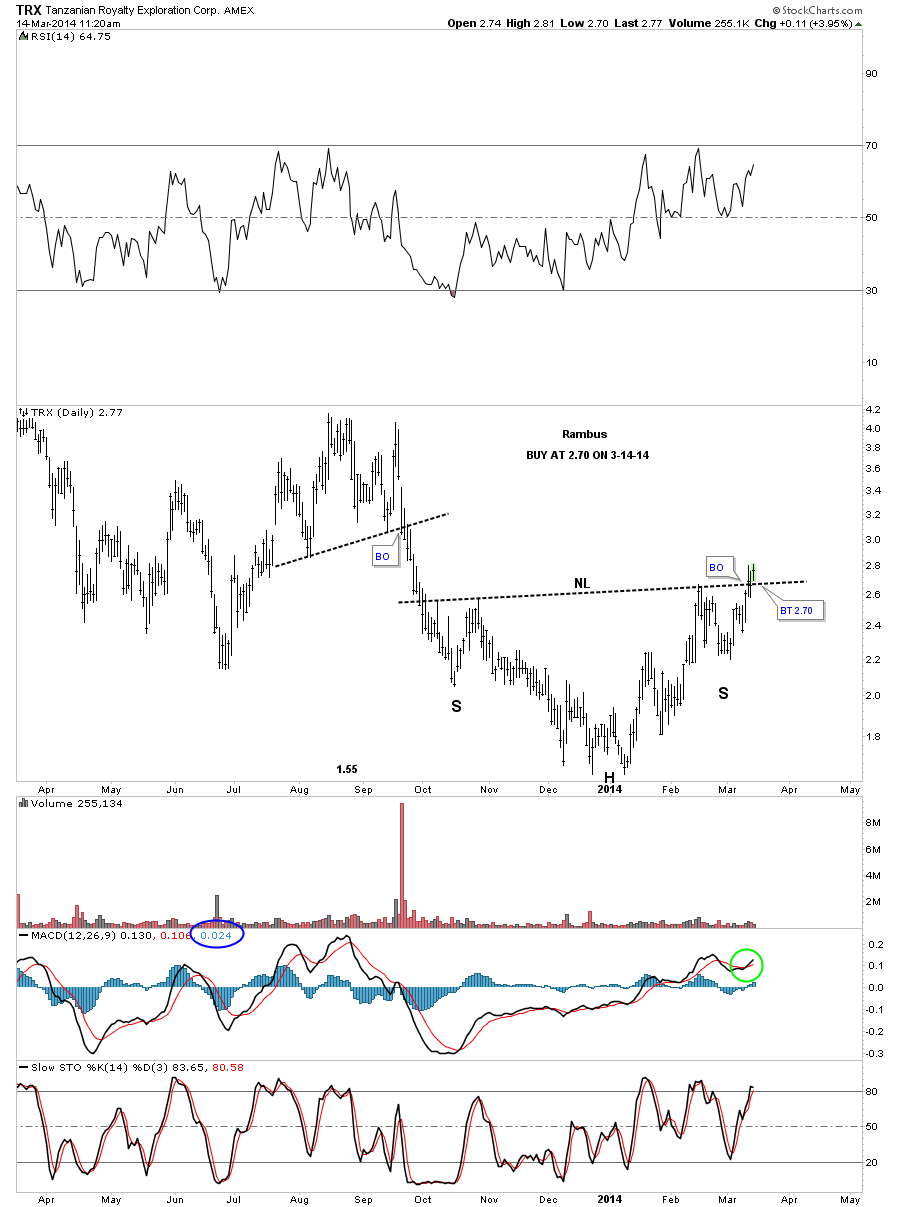
TRX has built a beautiful inverse H&S bottom and is now in the process of breaking out through the neckline. The MACD has turned positive with the blue Histogram now above the zero line. I’m going to buy it at 2.70 for the Extra Trade Ideas link just below the Model Portfolio stocks.
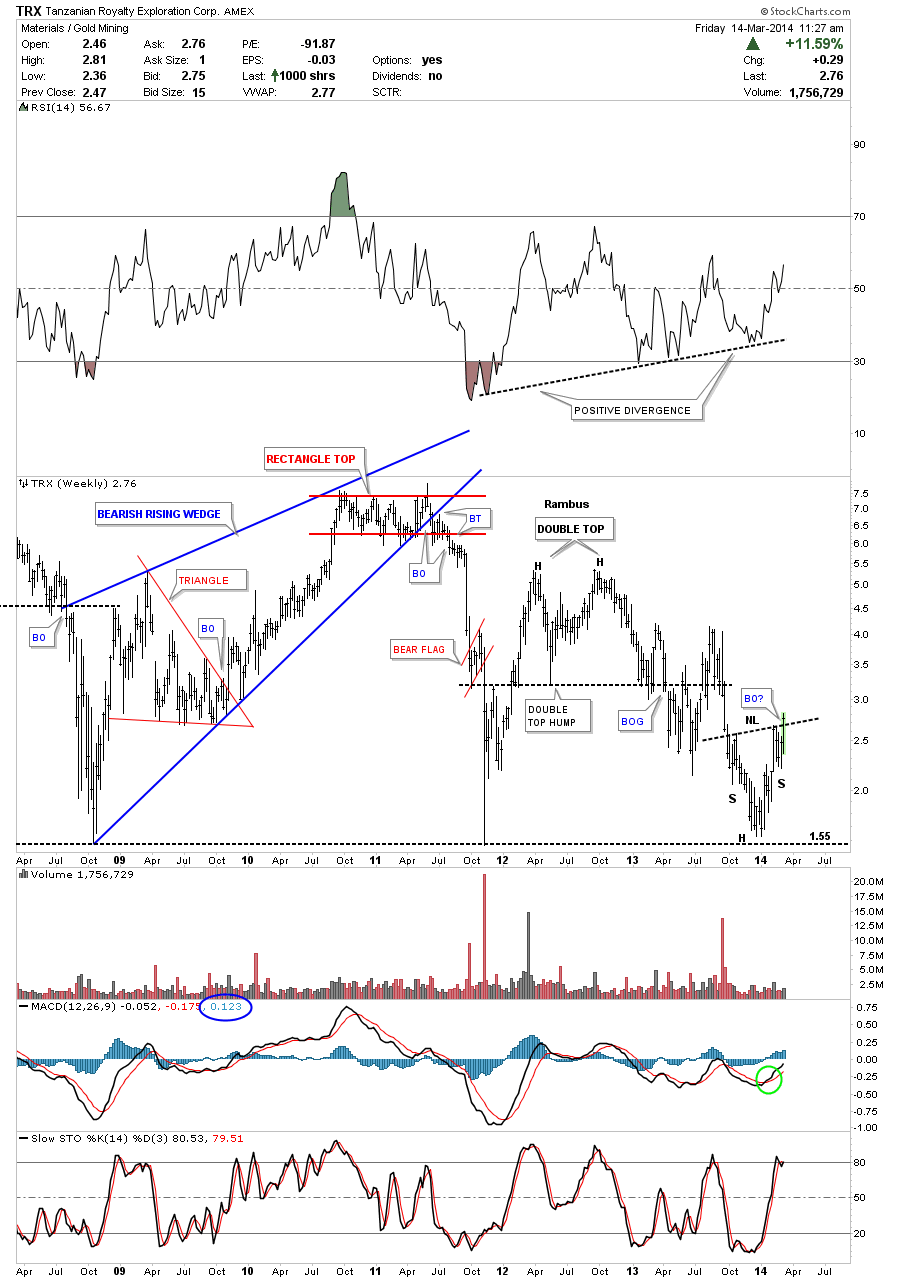
The weekly chart shows the inverse H&S bottom, that I just showed you on the daily chart above, that is forming right on the 2008 crash low as have so many other precious metals stocks. This is exactly the place you want to look for some type of reversal pattern. Notice the huge positive divergence with the RSI at the top of the chart. Also the MACD has a positive cross and the blue Histogram is above the zero line. Everything looks lined up and ready to go.
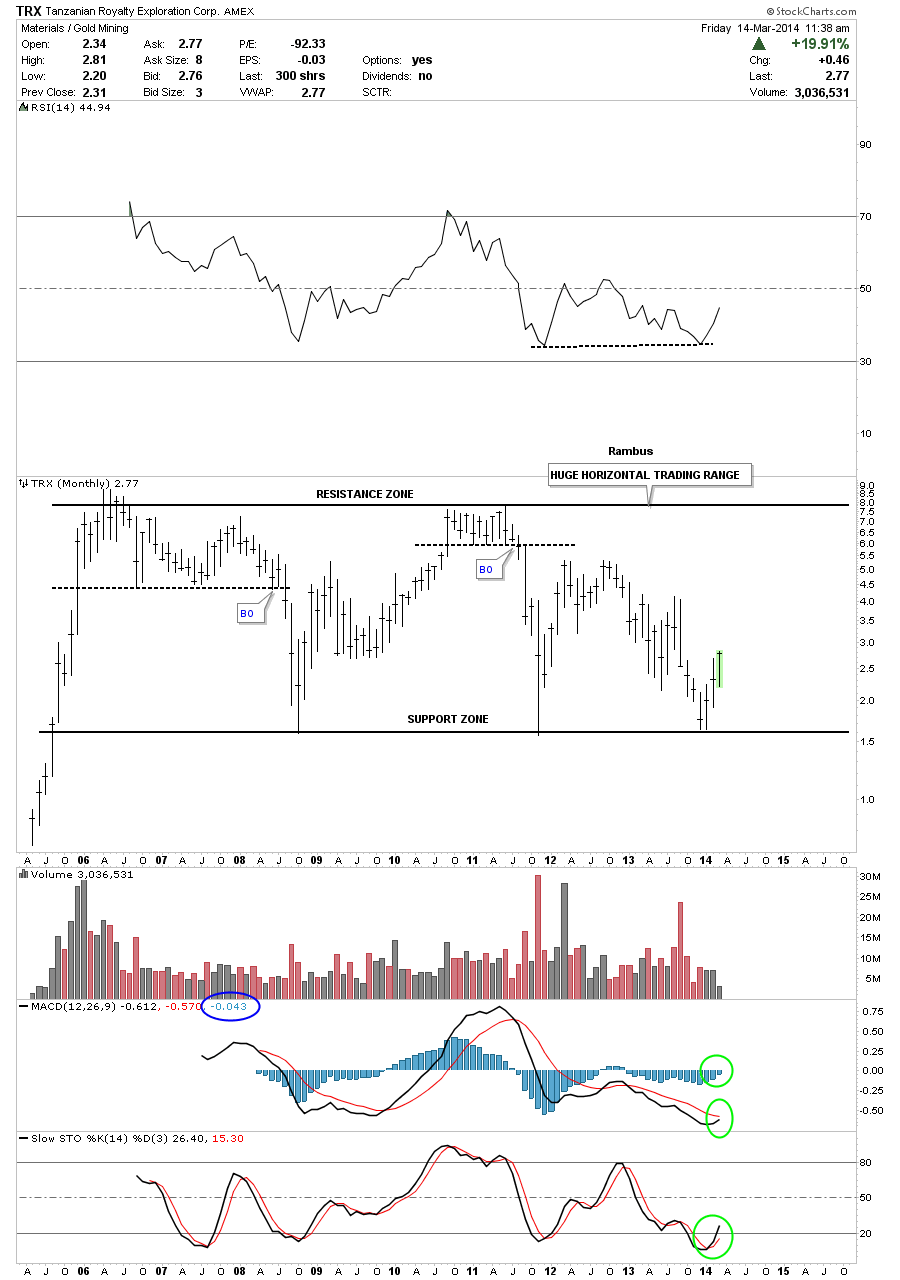
The long term monthly chart shows a huge trading range that goes back many years. Buy the bottom and sell the top until something changes. The monthly indicators are still slightly negative but are getting very close to turning positive. The monthly indicators let you know if your in an uptrend or downtrend which is key to understand. For the most part you want to trade in line with the big trend and scalp the counter trend.