
What a difference two weeks can make in the precious metals markets. Going from a confirmed downtrend to an uptrend, at least on the short term basis, was rather swift and didn’t leave much time for one to reverse direction to get back in sync with the new uptrend. At this time the rally is still in its infancy as there is more work to do but there are some positive things taking place, over the last two weeks, that could show us a major turning point maybe taking place in the precious metals sector. As always it’s one step at a time with each step confirming or not confirming the price action. In this Weekend Report I would like to look at the HUI to see how things have changed over the last two weeks. With that being said the first thing we need to see is a higher low to even consider an uptrend is taking place. Below is a daily line chart that I showed you a month or so ago that shows the big long black dashed support and resistance rail, possible neckline, that defines the positive or negative trend for the HUI. Below is negative and above is positive. At the time I showed you this chart there was no right shoulder in place as the price action was declining after hitting that big S&R rail. As of right now you can see the June low is higher than the December 2013 low which is the first sign of a possible new uptrend taking place. I’ve added some smaller black dashed horizontal lines that shows how the support and resistance lines have been working . The HUI has now rallied back up to the 236 area where it’s finding some very short term resistance. The perfect breakout scenario would be to see the HUI rally above the last horizontal resistance line at 236, hit the big S&R rail or neckline, back off to the 236 area and make a run above the big S&R rail which I would then consider to be the completion of a one year inverse H&S bottom.The potential neckline is now at the 250 area which is the most important number to watch for a breakout and confirmation of the bottom and a new uptrend is underway. There is a very bullish setup with the RSI indicator at the top of the chart that shows us a hidden bullish divergence. Note how the RSI made a lower low in June vs the December low while the HUI made a higher low in June vs the December low. This is a very positive sign for the HUI. 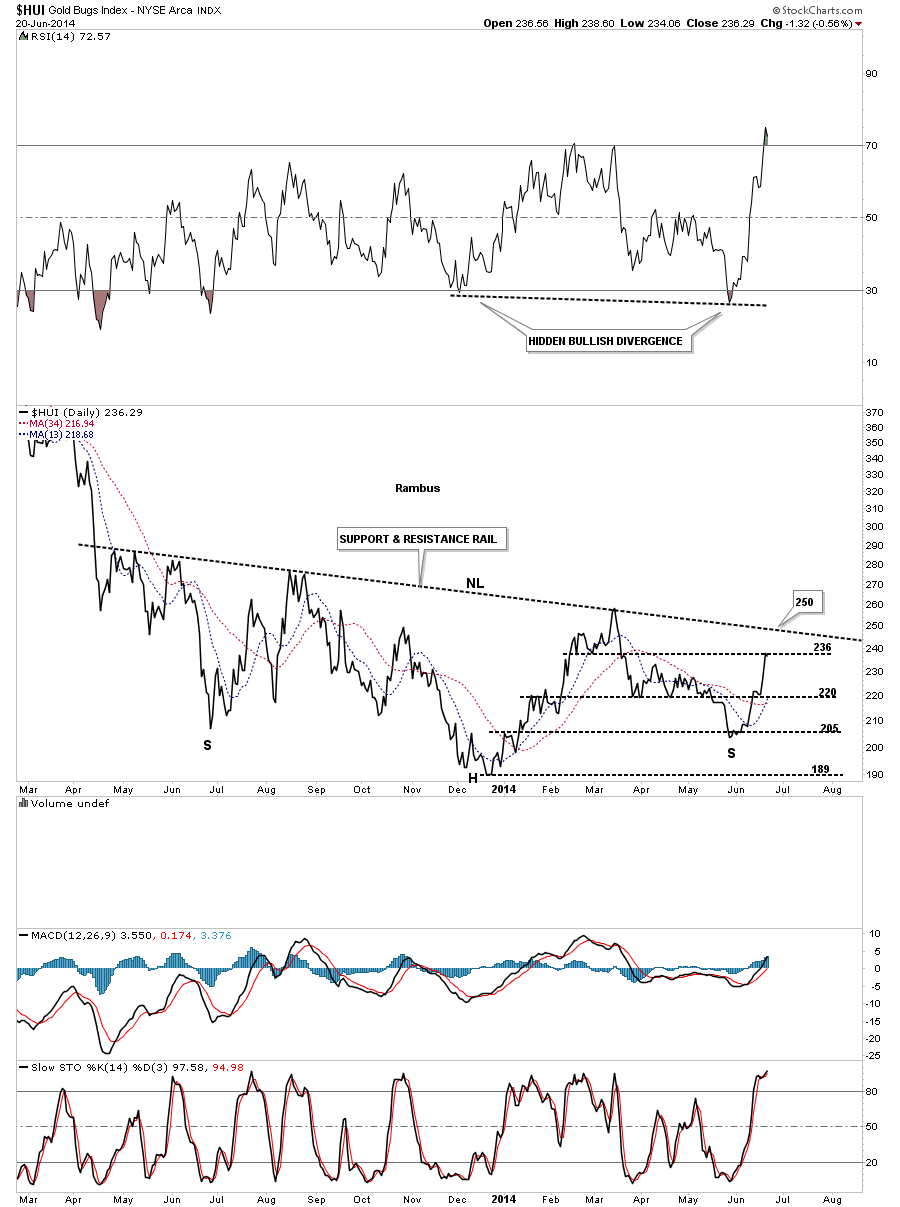 Next I would like to show you another very important support and resistance line, on the long term weekly chart, that showed the initial H&S top several years ago right after we opened our doors at Rambus Chartology. The top neckline #1 shows the support and resistance rail starting all the way back in 2009 and didn’t end until the HUI finally broke below it for good in November of 2012. The red arrows shows how it acted as resistance and the green arrows shows how it reversed its role to support once it was broken to the upside. Note the breakout from the upper neckline #1 that looked like the smaller H&S was complete and the new bear market was beginning. If you’ve been in the markets for any length of time you know there can be false breakouts for even the best looking patterns. As you can see the price action fell down to create a double bottom that looked like it was going to negate the upper H&S top. The purple arrows shows the price broke above neckline #1 but quickly burned out and reversed and declined back below neckline #1. This is how the markets talk to you. Once the price action traded back below neckline #1 is when we went short as the HUI was trading back below the support and resistance rail which ended up creating a bull trap. The rest is history from that bull trap just above the S&R line. From that point is where the bear market really started to accelerate to the downside. Now lets fast forward to our recent bottom. You can see how the red arrows have been holding resistance for over a year now. What has developed over the last two weeks is the low last June and our current low this June are at the same low with the December low being the low for this bear market so far creating the possible inverse H&S bottom. I’ve labeled the December low as a bear trap because that’s what its been so far. As I’ve pointed out many times in the past that when you get a false breakout its usually the final washout phase before the price action reverses its trend and moves strongly in the opposite direction leaving many behind that failed to see what took place.
 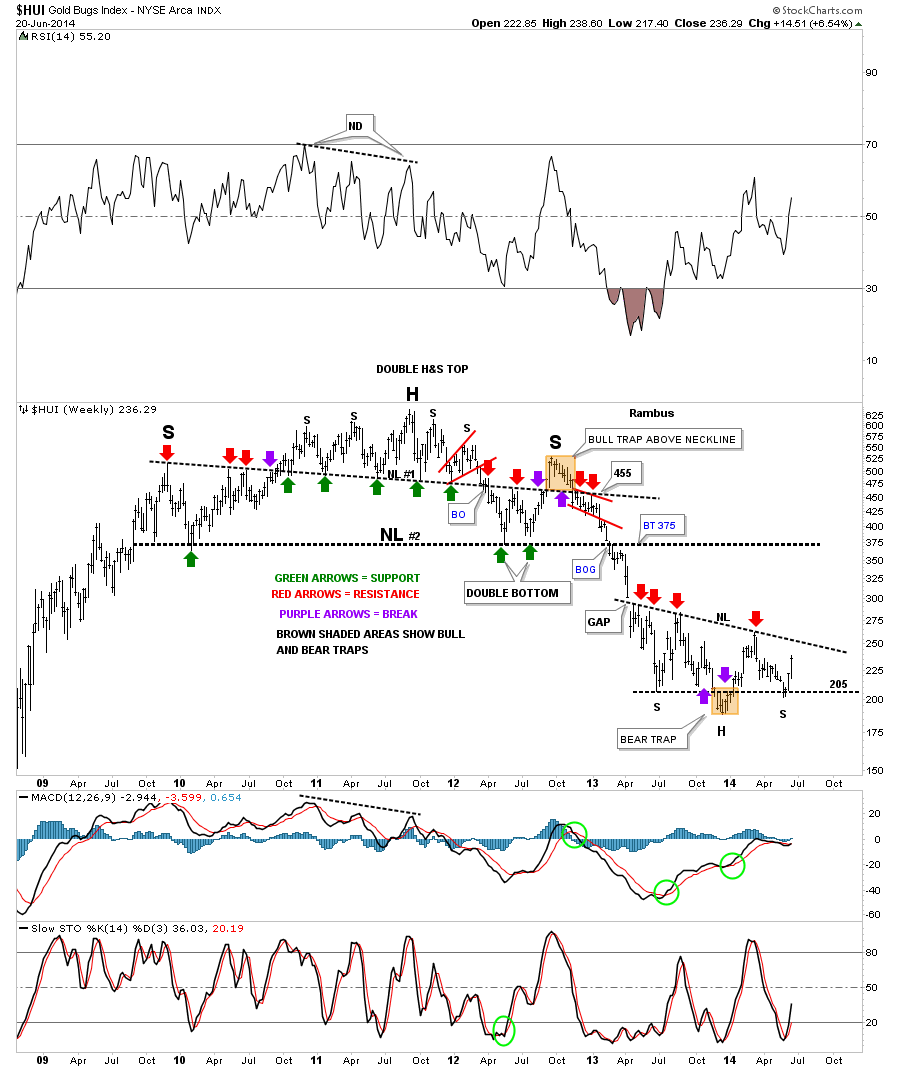 This next chart for the HUI is a shorter term daily look that shows you just how fast the HUI went from a bearish setup to a bullish setup in just two weeks time. First lets focus in on the blue falling wedge that had a breakout accompanied by a breakout gap that looked very promising. At the time I had a parallel downtrend channel that was made by taking the the top black rail of the now bullish falling wedge and adding it to the late March low. Also notice the brown shaded support and resistance zone that had been working very well defining when the HUI was positive or negative. Once the HUI broke below the bottom blue rail of the falling wedge and the brown shaded support and resistance zone it looked very promising that the price action was headed back down to the the December low. After the initial breakout the price action chopped around for a little over a week consolidating the drop out of the blue falling wedge. Nothing looked abnormal at that point. The first real sign that something was amiss with the downtrend is when the HUI gapped above both the blue rail of the falling wedge and the top rail of the black falling wedge. That was a major red flag for me as that wasn’t supposed to happen and when something that isn’t supposed to happen, happens, one needs to take a good hard look at the new situation with a open mind which is exactly what I did. Note how the second days price action, after the breakout from both falling wedges, rallied all the way through the brown shaded support and resistance zone which should have been strong resistance. As you can see on day number three of the breakout the HUI traded at the top of the brown shaded support zone which now had reversed its role to what had been resistance to now support over the next four days. The 50 dma also came in at the top of the brown shaded support and resistance zone to offer its own support. That’s all I need to see to then go long NUGT on June 13th along with USLV. As with any discipline in the markets, whether it be Elliot Wave, cycles or whatever one needs to have confirmation of a trend change before you invest your hard earned capital.
 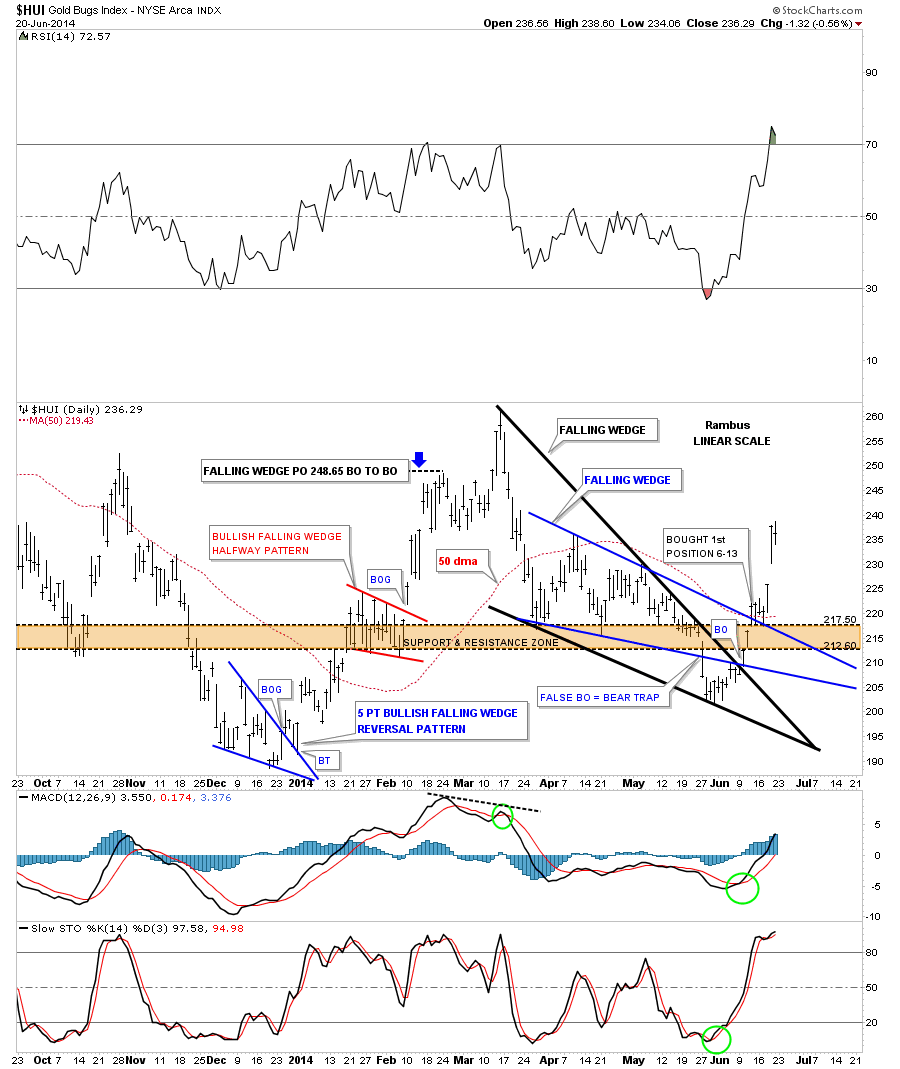 Next I would like to show you the complete history for the HUI that shows all the consolidation patterns and impulse moves during its secular bull market. I have said this many times in the past , the precious metals and precious metals stocks create some of the best looking chart patterns of any sector out there. Note the beautiful blue triangle consolidation patterns that formed during the HUI’s bull market years up until the 2008 crash. The red arrows shows where the actual impulse moves began at the last reversal point in each consolidation patterns. Note the beautiful H&S top in 2008 that led to the first real correction for the HUI. Next you can see the massive H&S top that has led to our current low. What I find potentially very bullish is where our current and potential inverse H&S is forming. Since the December low last year, which is the head portion of the inverse H&S bottom, the bottom rail of the major uptrend channel has just made its second low which is a higher low , the June 2014 low on the bottom rail. This one year inverse H&S bottom is forming exactly where one would want to see a reversal pattern like this form. Note the RSI at the top of the chart that is showing a very large bullish hidden divergence. It’s also showing a series of higher highs and higher lows. When looking at the indicators on the sidebar you can see the price action on the blue histogram has just moved above the zero line and the MACD has just had a positive cross. The slow Stoch has just crossed and in now above 20.
 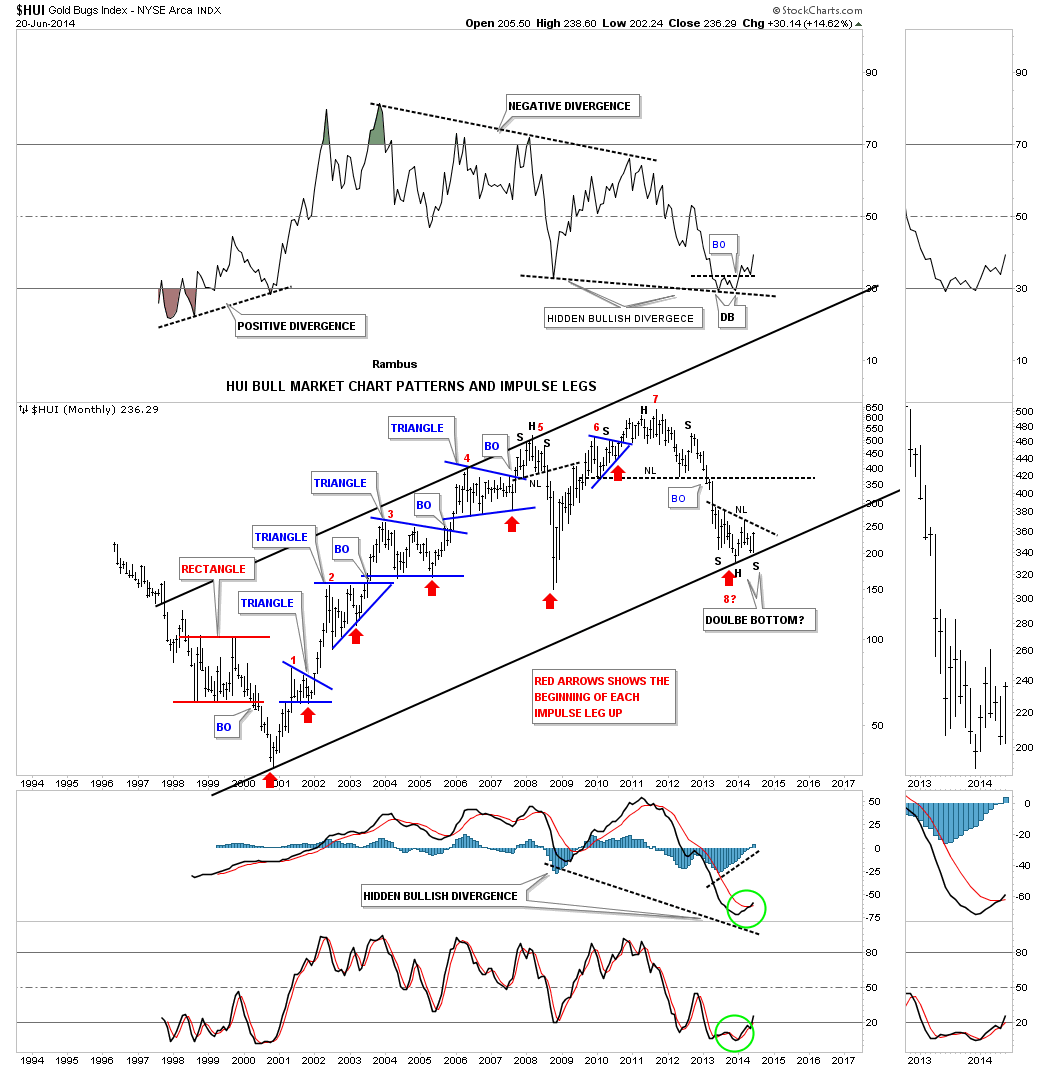 Below is just a simple weekly candlestick chart for the HUI that shows the inverse H&S bottom that has been developing for one year now. There are a lot of ways to use candlesticks but I like to use the back and white candles to show me when a stock is in an impulse move. When there is a strong impulse move down you will see a string of back candles and when a stock is in a strong impulse move up you will see a string of white candles on the weekly and especially the monthly charts. This week marks the third week in a row now that we’ve seen a white candlestick. One last note on this chart. As you can see the June low in 2013 and our current June low happened at the same price with the head portion, of this potential inverse H&S bottom, being the bear market low made in December of last year. There has been a 6 month time cycle in the PM complex that has been around since the beginning of the bull market. Sometimes it gets out of whack a bit but I always look for the June and December months for changes in a trend.
 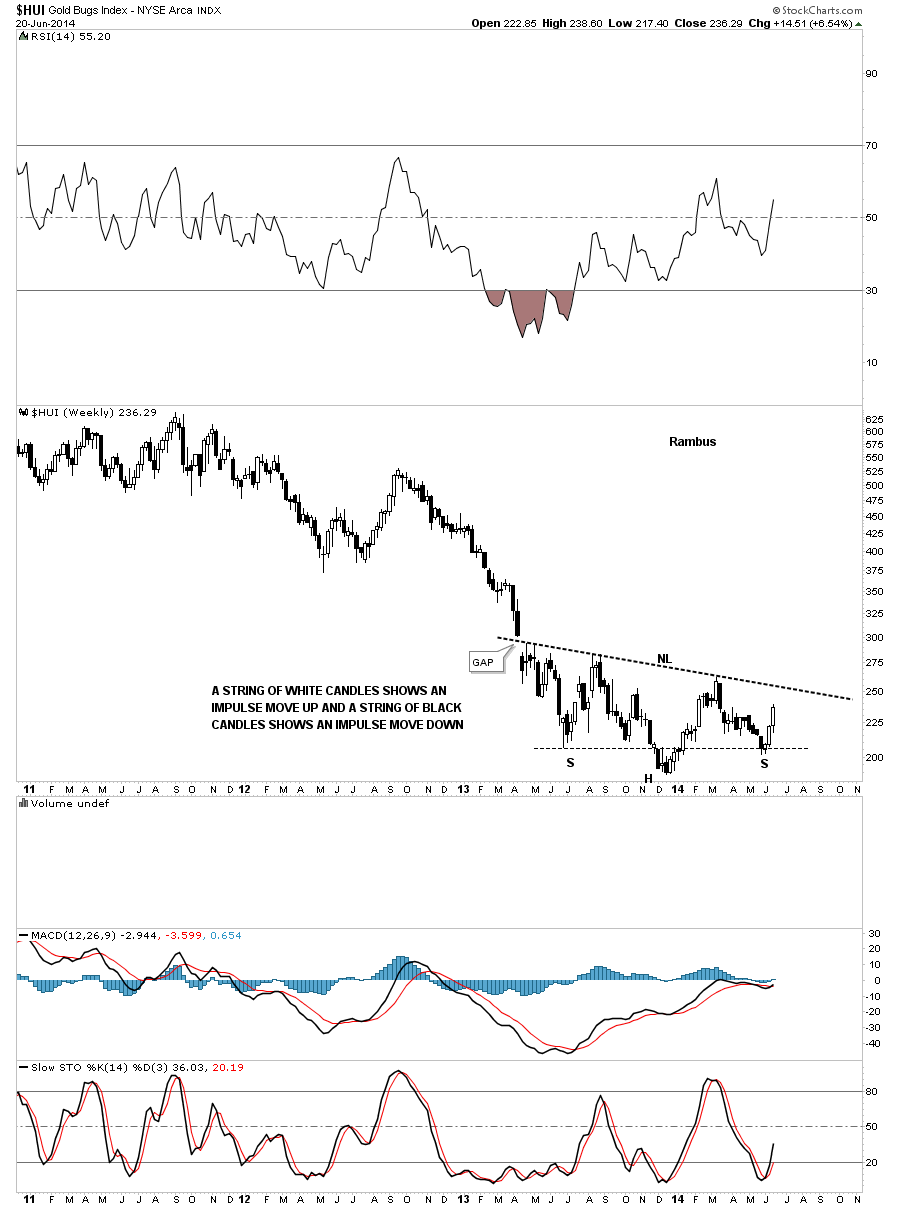 This last chart for the HUI is a long term weekly look that shows a roughly three year time cycle. If the HUI is truly embarking on the next big three year rally cycle then we’re going to see some very strong rallies followed by periods of consolidation that will make it hard to ride the bull. We may not pick the absolute high or low, no body does, but with Chartology on our side we will be able to look for different chart patterns for clues on what to expect next. I’ve moved the black three year rectangle to the right just a tad so you can see our June low. I have just one simple question to ask as you look at this chart below.
What if this is THE BOTTOM? 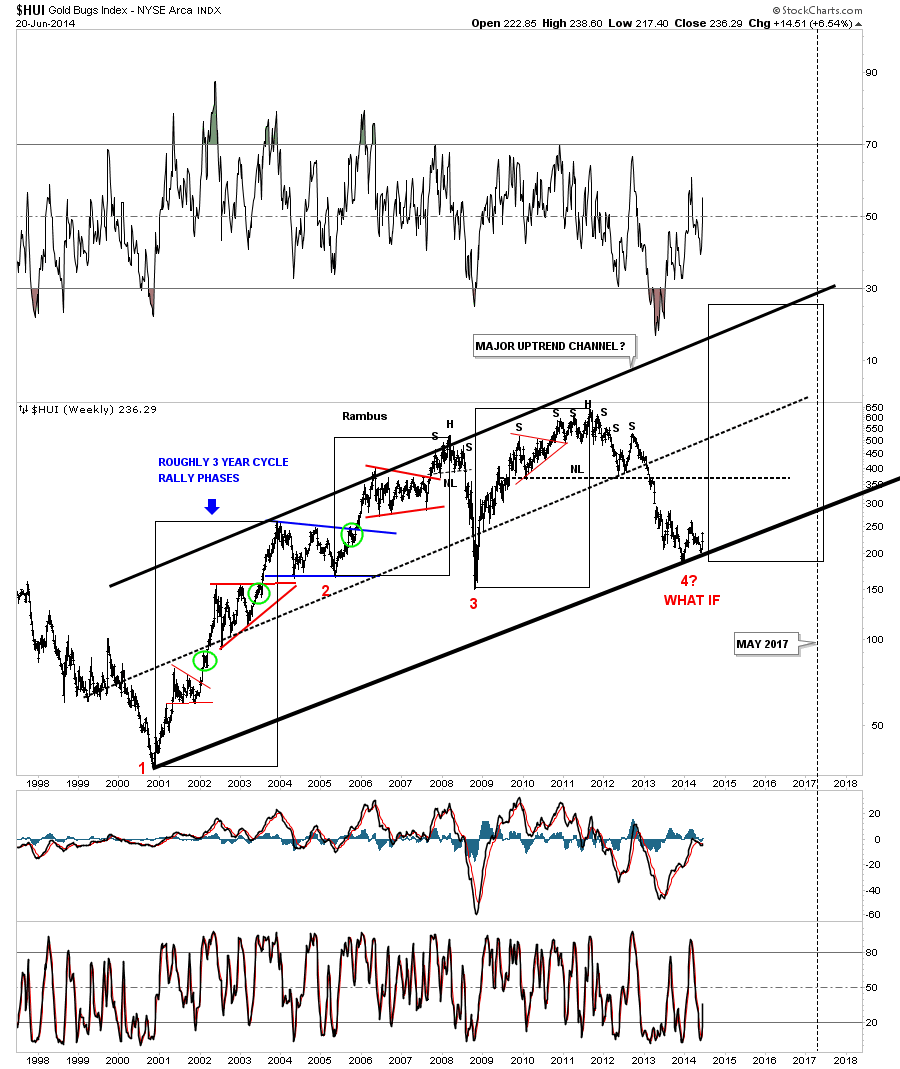
All the best…Rambus