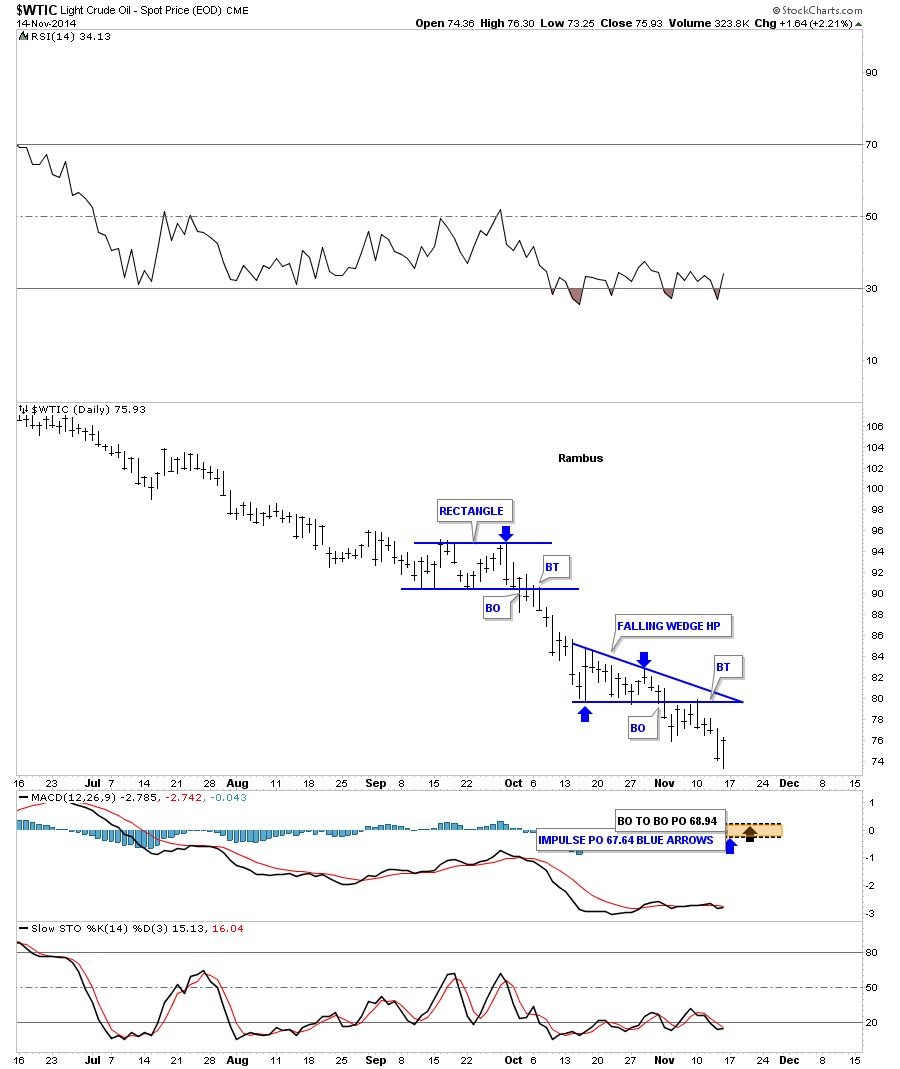
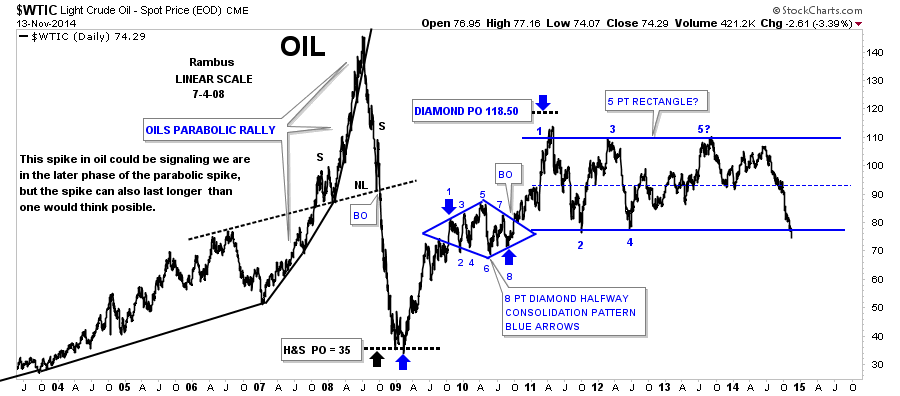
Yesterday we took a second position in SCO which is a 2 X short oil etf. Lets take a more indepth look at oil which is showing it’s finally breaking down from a massive topping pattern. We’ll start with the short term daily chart that shows the breakout and backtest to the bottom rail of the little blue bearish falling wedge. I’m using it as a halfway pattern to get a measurement based on the blue rectangle that traded just above the blue falling wedge. The blue arrows shows the impulse method of measurement along with the breakout method that shows the price objectives down at the bottom of the chart as shown by the brown box. This is just a very short term price objective.
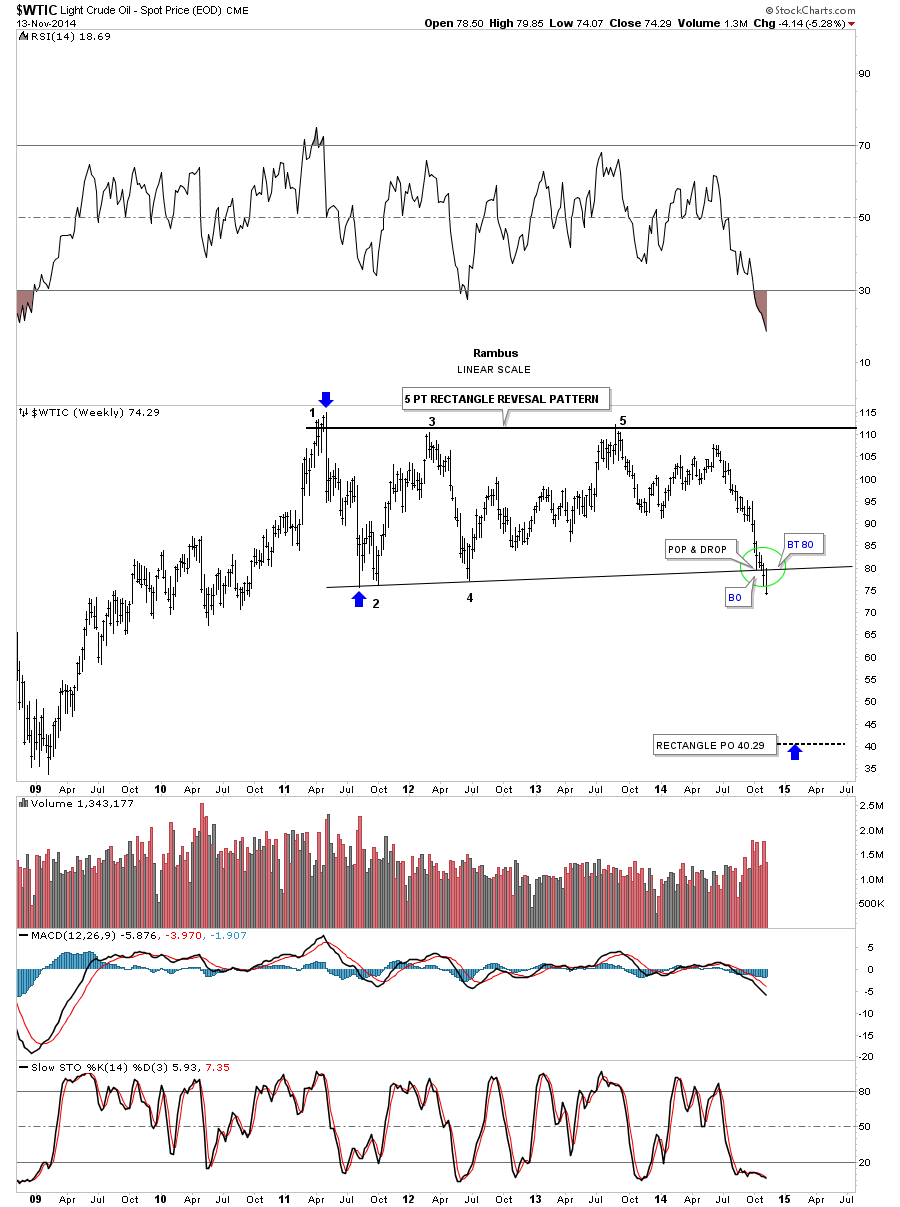
Below is a weekly chart that shows the bigger picture which is a 5 point rectangle or if you want to be really picky, a 5 point triangle reversal pattern. Both the top and bottom rails are pretty horizontal but they do have a very slight slope to them. Also this has to be a 5 point pattern because it has formed off of the 2009 low. Remember an odd number of reversal points creates a reversal pattern. A double top or bottom have 3 reversal points. A H&S has at the minimum of 5 reversal points. A triangle or rectangle needs at least 5 reversal points. An even number of reversal points creates a continuation consolidation pattern. So with that in mind lets look at the rectangle/triangle and see how it turned out.
You can see the the consolidation pattern has 5 reversal points that shows it to be a reversal pattern to the downside. Next I want to focus your attention to our current price action as shown by the green circle. I originally had the bottom rail in a horizontal position. It’s very important when drawing a trendline to look for certain things. If you look real close inside the green circle you can see a small pop and drop pattern that we’re experiencing on gold’s breakout right now. This weekly chart for oil shows the first weekly bar hit the trendline and then got a small bounce for two weeks. On the fourth week you can see oil broke below the bottom black rail in a breakout move where we took our initial position in the 2 X short oil etf SCO. Notice the very last bar inside the green circle which is this weeks trading action. As you can see it made one last rally attempt that was stopped dead in its tracks at the bottom rail at about 80 or so.
Once you suspect a stock is breaking out always tweak your trendline which will usually show you up close and personal the breakout and backtesting process. Most of the time you would be surprised on how cleanly a trendline can cut through the price action telling you exactly where the breakout is taking place. The chart below shows you this very clearly.
Since this is a reversal pattern the only way to measure for a price objective is to take the width of the triangle/rectangle and add it to the breakout point. This is another reason you want to know exactly where the breakout occurs. The blue arrows shows you the width of the reversal pattern, added to the breakout, gives you a price objective down to the 40.29 area. One last note on the chart below that shows the first reversal point began in, you guessed it, 2011. Oil is following the same path as most commodities and the precious metals complex.
The next chart shows you the parabolic run oil had that began with the inverse H&S bottom back in 2007. No one knew that a parabolic move was going to unfold over the next year or so. All I knew at the time was that oil put in that inverse H&S bottom reversing the downtrend. You can see the red rising bull flag that slopped up into the uptrend that always tells us the move is strong. The parabolic move up finished with that massive H&S top that had a price objective all the way down to the old all time highs for oil at 35. For those that would like to study what a parabolic move looks and feels line can isolate the price action between 2006 to 2010 in linear scale. Patterns like this are what chartists live for.
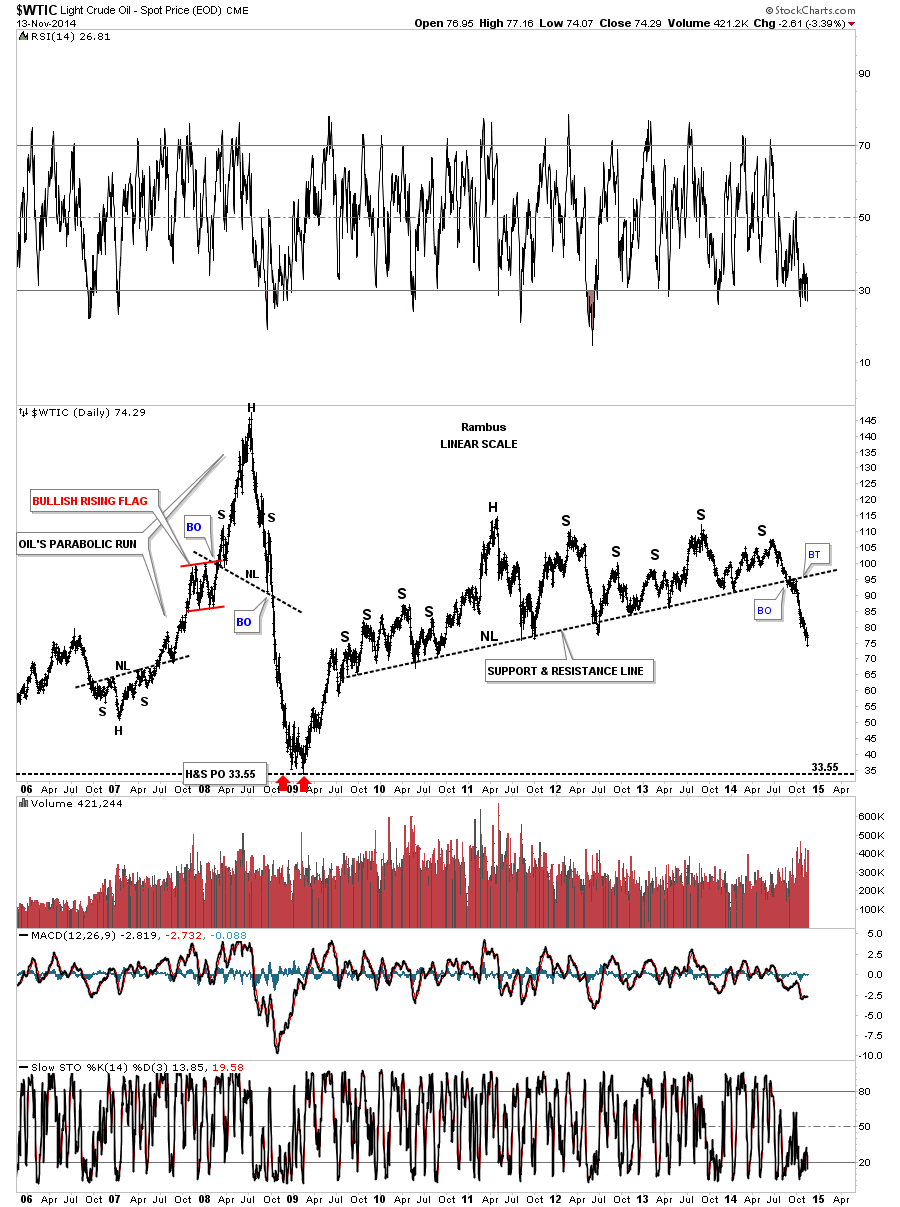
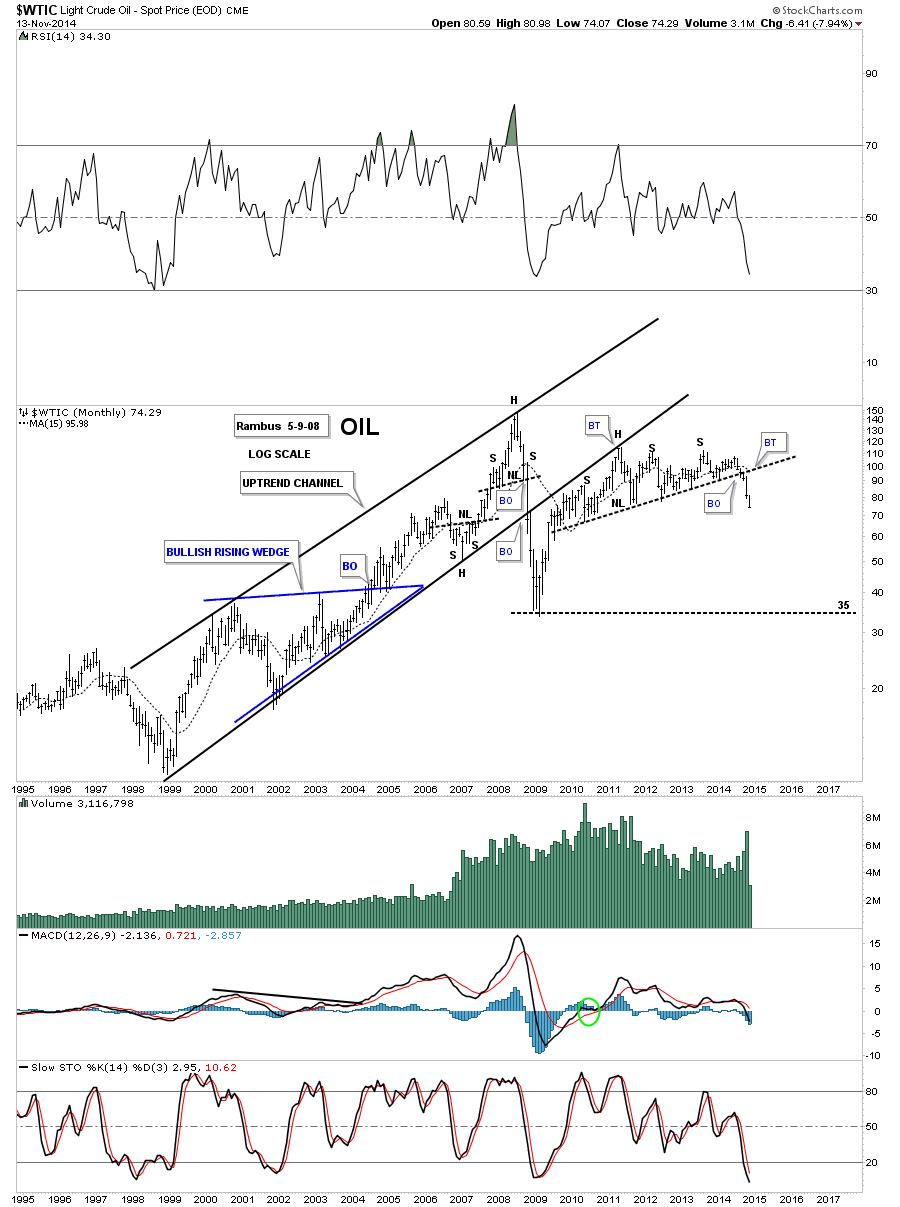
This next chart for oil shows the price action going back to 1995. Note the backtest to the bottom rail of the uptrend channel that occurred in 2011 which created the head of that massive H&S topping pattern. The bigness of these long term patterns tells you deflation is going to be around or sometime to come.
This next chart for oil shows my thinking back on July 4th 2008 when oil was going parabolic. It still hadn’t ended its parabolic run yet but I was on the lookout for a small H&S top or double top on the 2 hour charts looking for any kind of reversal pattern. I knew once the parabolic move up was over there would be a big decline but I had no idea at the time that oil would fall as far and fast as it did. It wasn’t until I recognize the bigger H&S top that I could come up with a downside price objective which ironically was at all the previous highs oil made in history around the 35 area, before oil broke that 35 boundary and started its parabolic rise.
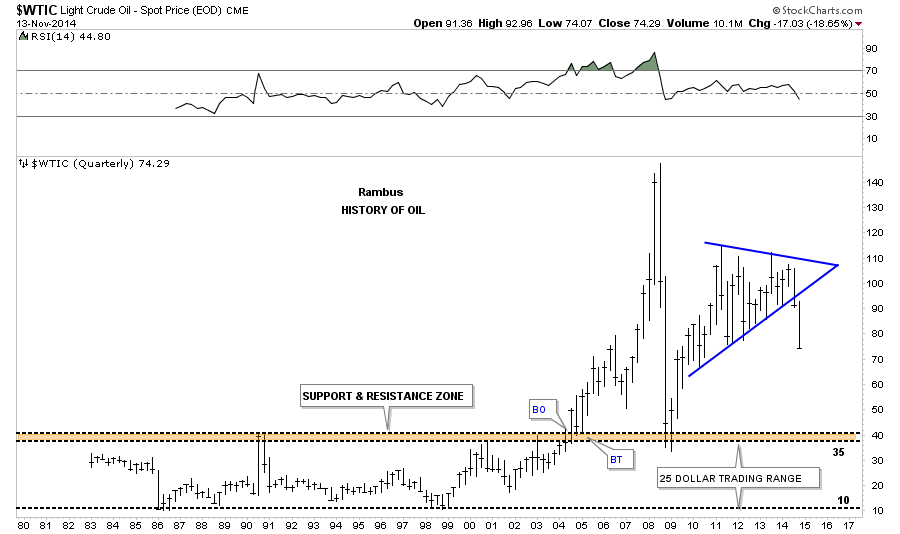
OK one last chart that shows the total history of oil going back to 1982. Notice the brown shade support and resistance zone at the 35 area that had kept oil in check until it broke out in 2004. Oil finally broke out above the brown shaded S&R zone in 2004 then backtested it in early 2005 which eventually led to the parabolic run to 147. Note how the parabolic crash found support right where you would have thought, right on top of the brown shaded S&R zone. What had been resistance for all those years turned out to be support during oil’s parabolic crash. Pretty amazing. All the best…Rambus