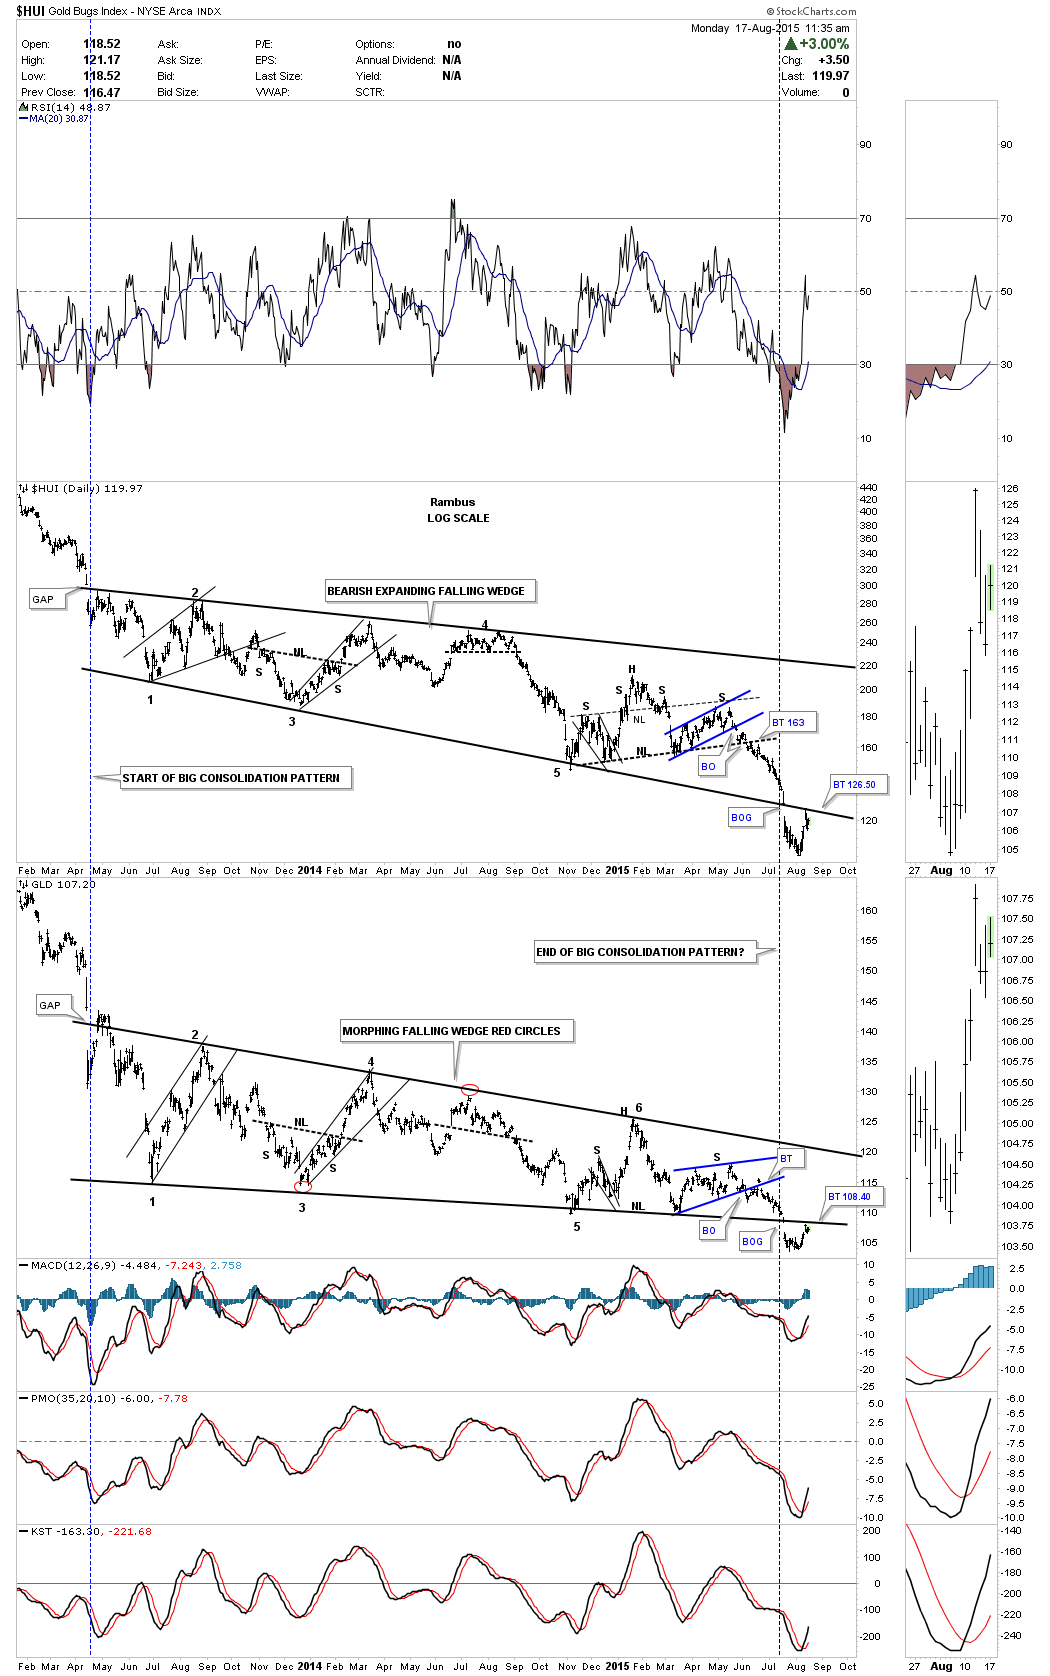
Below is the combo chart we’ve been following very closely for a very long time which shows the big two year trading ranges for the HUI and GLD. Both of the big trading ranges started to build out with a big gap to the downside in April of 2013. They have taken on slightly different consolidation patterns but both two year patterns have downsloping top and bottom trendlines which suggests weakness. They both broke to the downside together about four weeks ago with one backtest to their bottom trendline so far. At this point in time nothing is broken yet with their breakout moves which still looks normal.
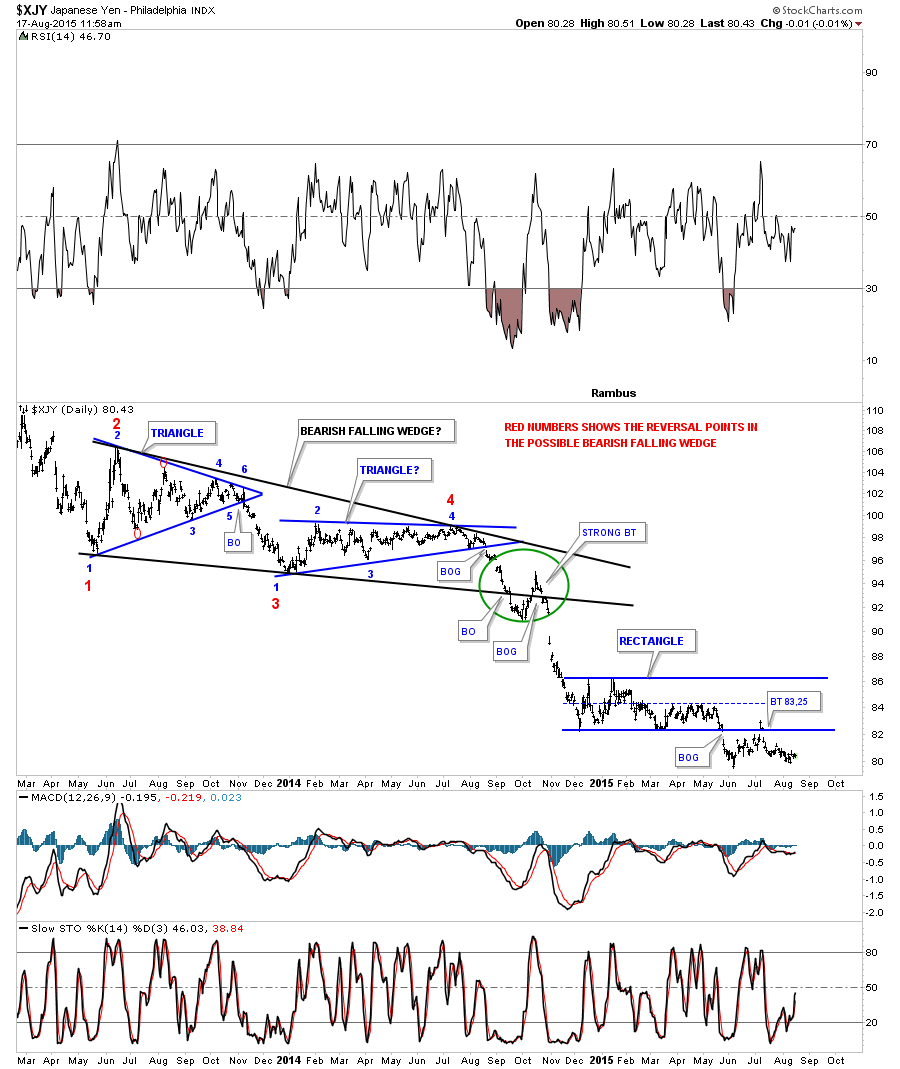
Below is a daily chart for the $XJY which shows a similar situation that the GLD finds itself in at the moment. You can see the big 18 month black bearish falling wedge which was made up of two individual smaller consolidation patterns which is fairly typical of big consolidation patterns. I’ve put a green circle around the breakout and backtest area that we followed at the time which showed a normal breakout but then the XJY had a strong backtest. If you look real close you can see a tiny H&S top that formed just above the bottom black trendline, labeled strong backtest, which when completed gapped down taking out the bottom black rail of the bearish falling wedge at the same time. And if you look really really close you can see one last little backtest to the bottom black rail before the impulse move finally got going to the downside. The reason I’m showing you this chart is because sometimes things aren’t textbook but the essence of the big black bearish falling wedge was still in play and worked out as expected.