First I would just like to thank everyone for their patience during this unfortunate situation we find ourselves in. Just know everything humanly possible is being done behind the scenes to get Rambus Chartology back up and running better than ever. Rambus
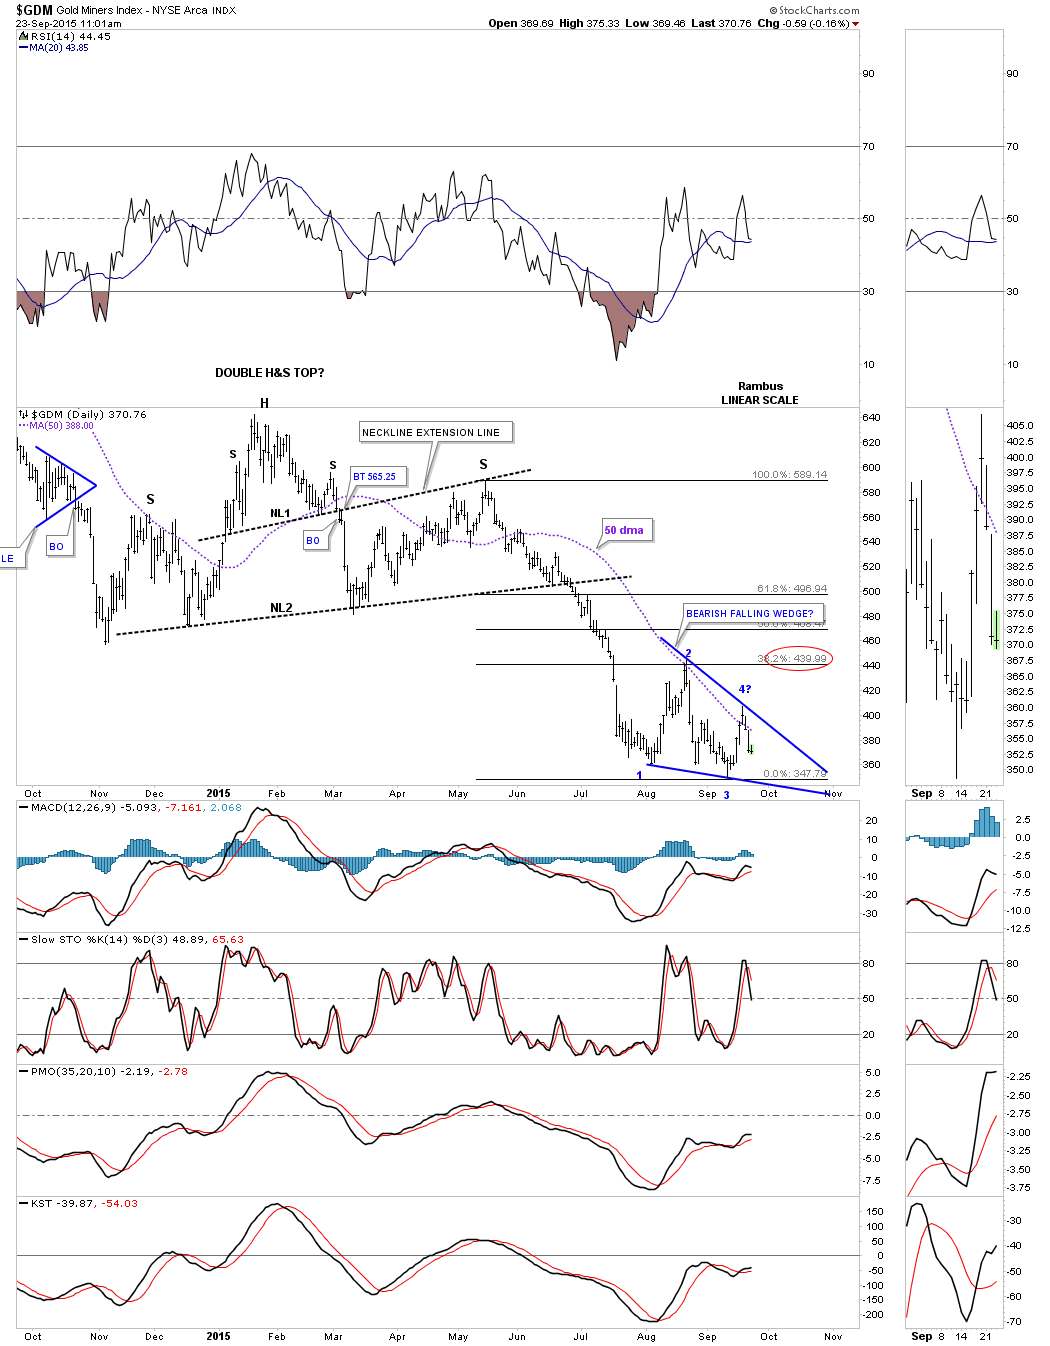
There is a potential pattern taking shape on the daily chart for the GDM that was virtually undetectable until yesterday. After slightly closing above the 50 dma the GDM has been declining back down to the bottom of the recent trading range that began at the August low. I have always viewed this little trading range, at the bottom of the chart, as a halfway point in the decline that began when the H&S / triangle broke down back in June of this year. Last Friday’s high may very well be the start of the 4th reversal point to the downside which won’t be complete until the bottom rail of the potential bearish falling wedge is hit. This is a perfect area for a small consolidation pattern to form. As you know there can be 2 or more individual chart patterns that form a bigger pattern. Originally I was looking at the possible H&S consolidation pattern as the halfway pattern and still is part of the nearly two month trading range.
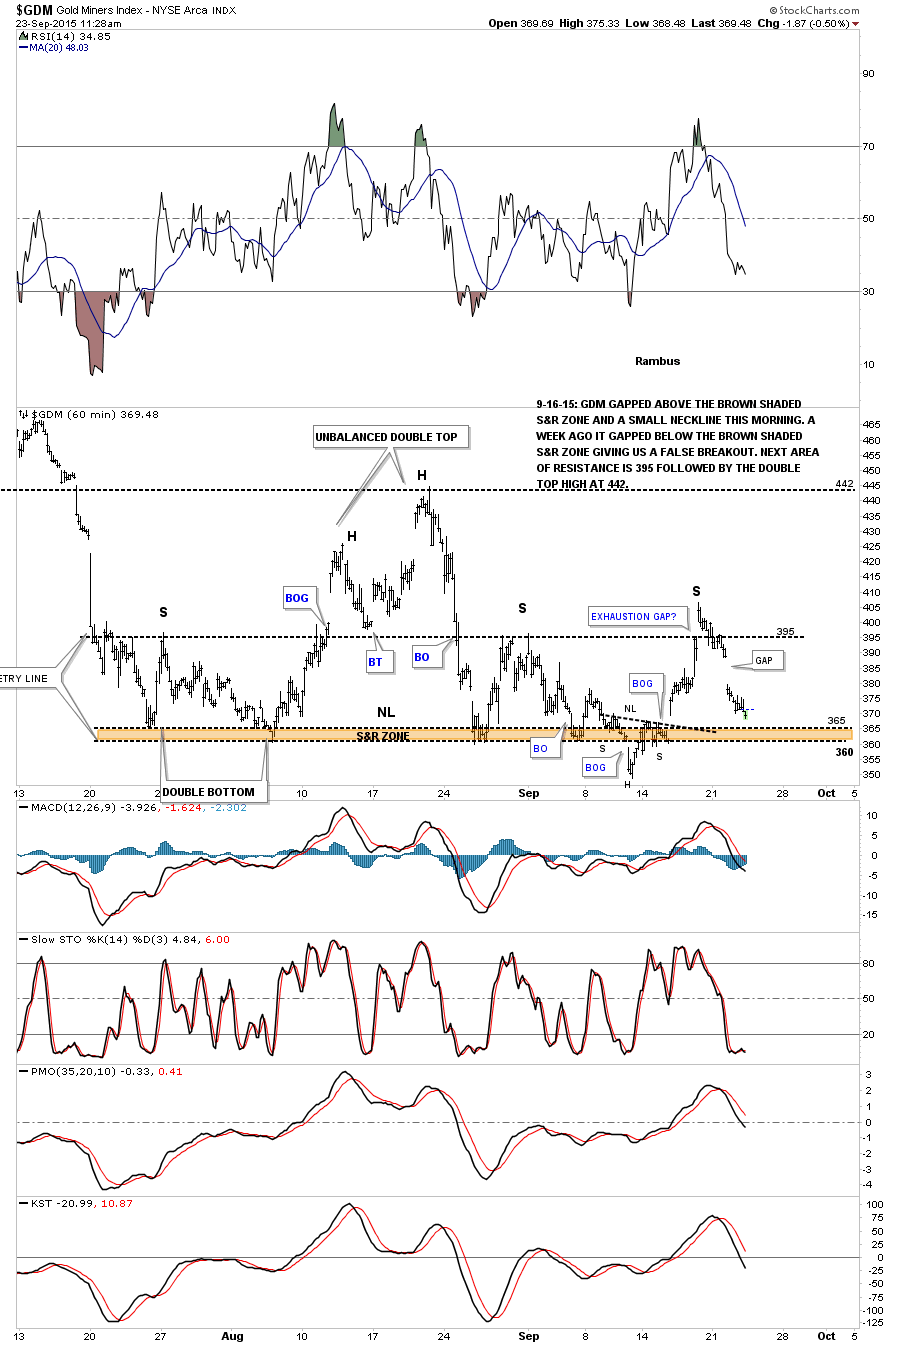
Below is the 60 minute chart for the GDM we’ve been following very closely during the formation of the H&S consolidation pattern. You can see what looked like a breakout when the price action gapped below the brown shaded S&R zone or neckline. The markets have a way to shake the bush before the original move you were looking for actually gets a chance to take place. The GDM rallied back up to the area of the tops of the left and right shoulders and with one finally gasp it gapped above the right shoulder high putting in an exhaustion gap. Now we have an unbalanced H&S consolidation pattern with one left shoulder and two right shoulders. Keep in mind this small potential trading range is still developing. Also there was a big gap made yesterday that may get tested.