
Just a quick update which shows the GDM is now testing the top of a big gap made last week. It’s still possible that it could be forming an unbalanced H&S consolidation pattern with 2 right shoulders and one left shoulder.

Last week I showed you this potential bearish falling wedge that is working on its fourth reversal point to the downside with the 50 ma holding resistance.
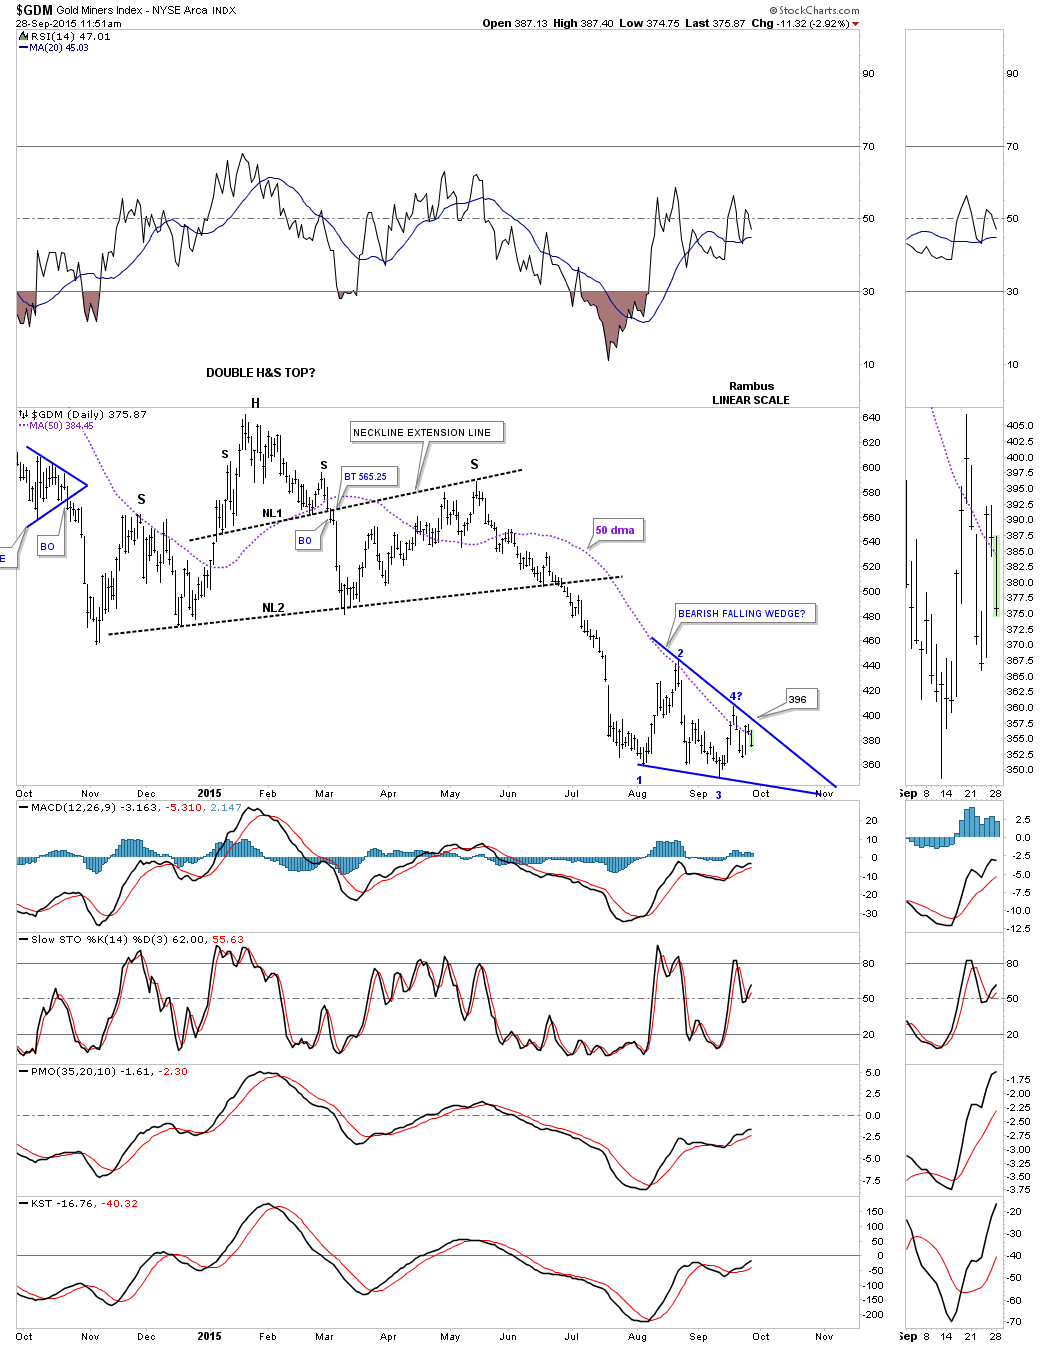
This long term daily chart for GDM is the most important chart to keep a close eye. We have the massive 2 plus year bearish expanding falling wedge in black that is made up of several smaller blue consolidation patterns. You can see how the bottom rail of the black expanding falling wedge and the top rail of the possible red bearish falling wedge are intersecting at 392 or so. I have shown you many times, and you’re probably getting tired of me telling you, but when you see a smaller consolidation pattern form just below an important trendline, bottom rail of the 2 plus expanding falling wedge, this is generally a bearish setup. This could very well be our last really low risk entry point to short the precious metal stock indexes using whatever short etf that matches your risk tolerance. The next place to add shorts will be if the bottom rail of the red bearish falling wedge gives way.
