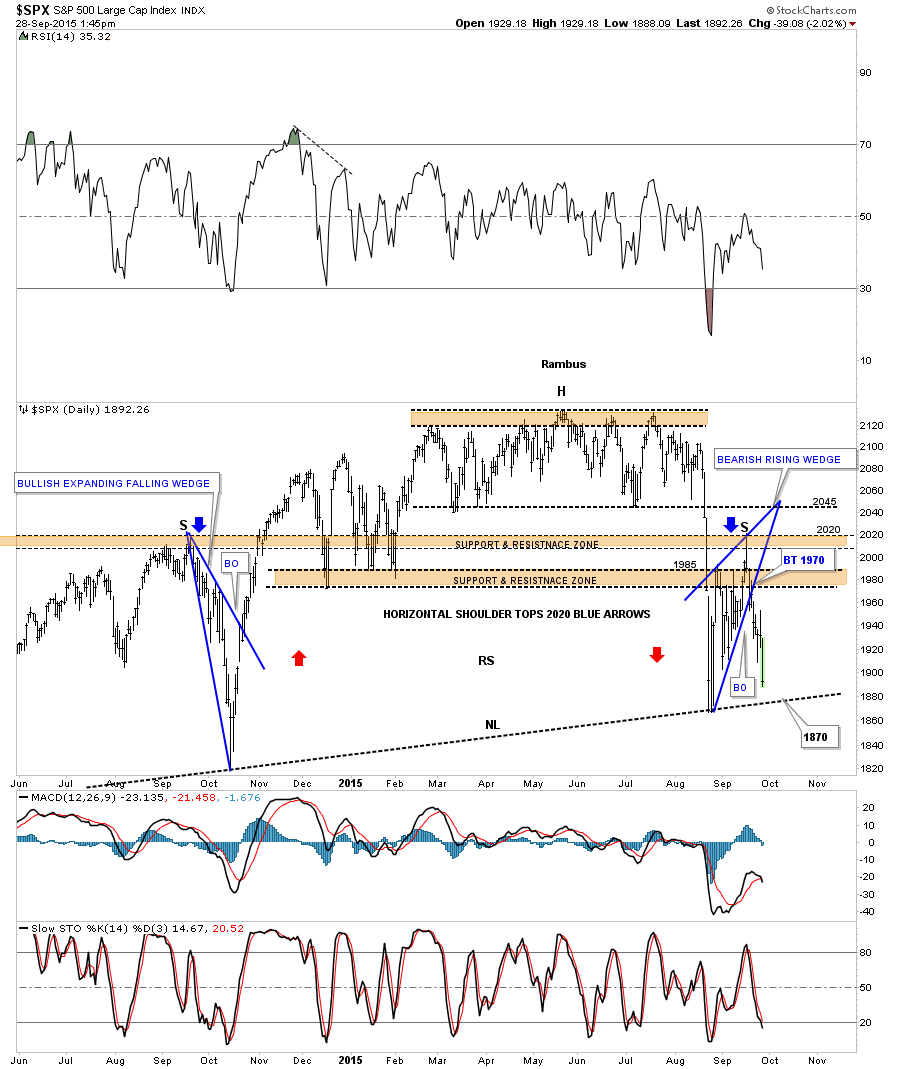
Below is the daily chart for the SPX we looked at last week that is showing the potential H&S top. What I’m most interested in is how the price action inter acts with the possible neckline around the 1870 to 1875 area. If the neckline is valid we could see an initial bounce followed by a break below the neckline or we could see a gap below the neckline without any bounce. The potential neckline is the most important trendline on this chart right now.