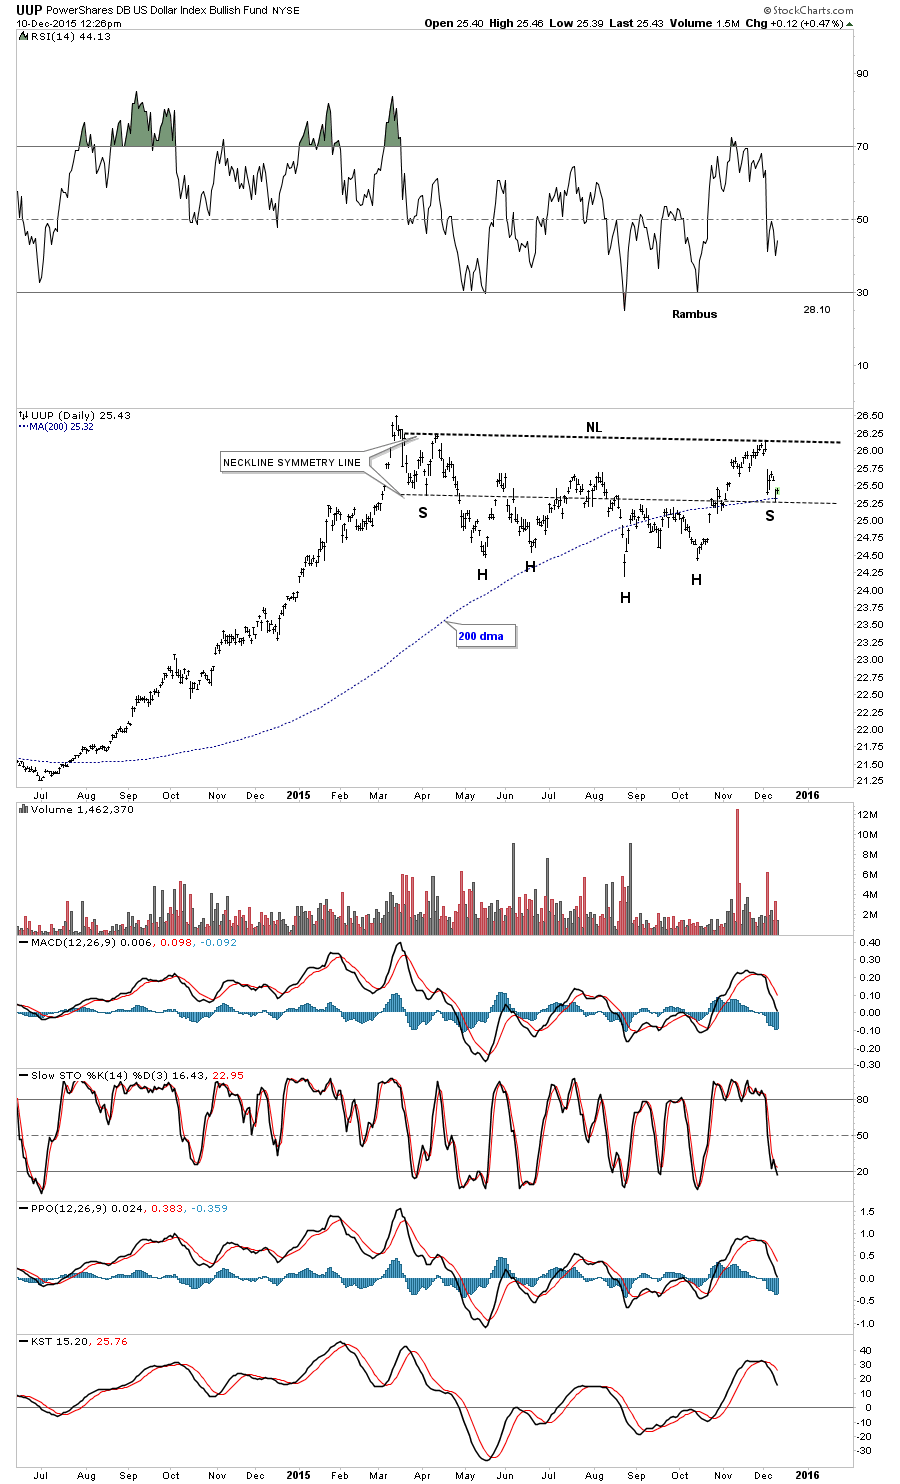
Below is a daily chart for the UUP which shows a possible H&S consolidation pattern forming that I touched on last night with the US dollar. As you can see it’s testing the 200 dma and the neckline symmetry line as a possible area of support.
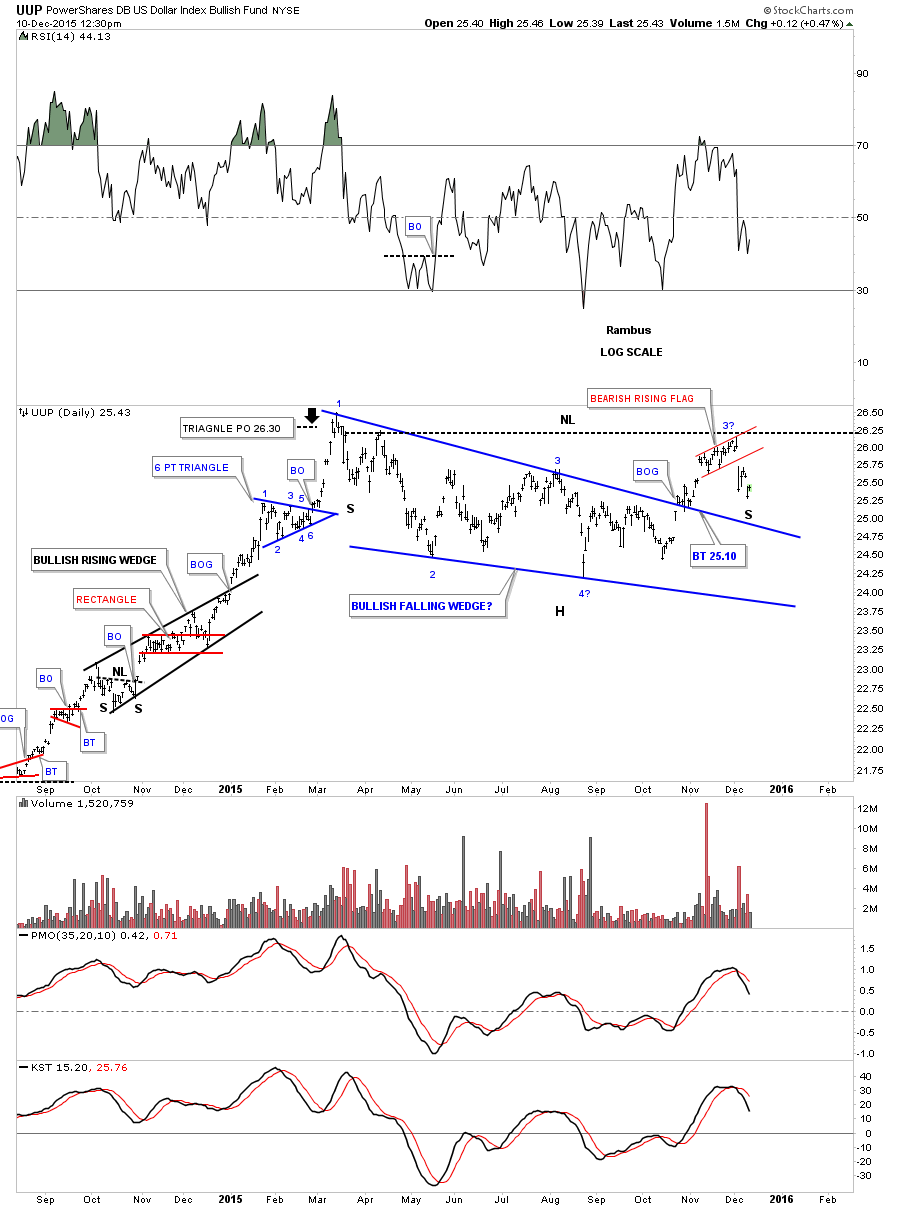
Here is the daily chart which shows the combo blue falling wedge and the possible H&S consolidation pattern. Again either pattern would have a bullish outcome if the UUP can breakout above the March highs.
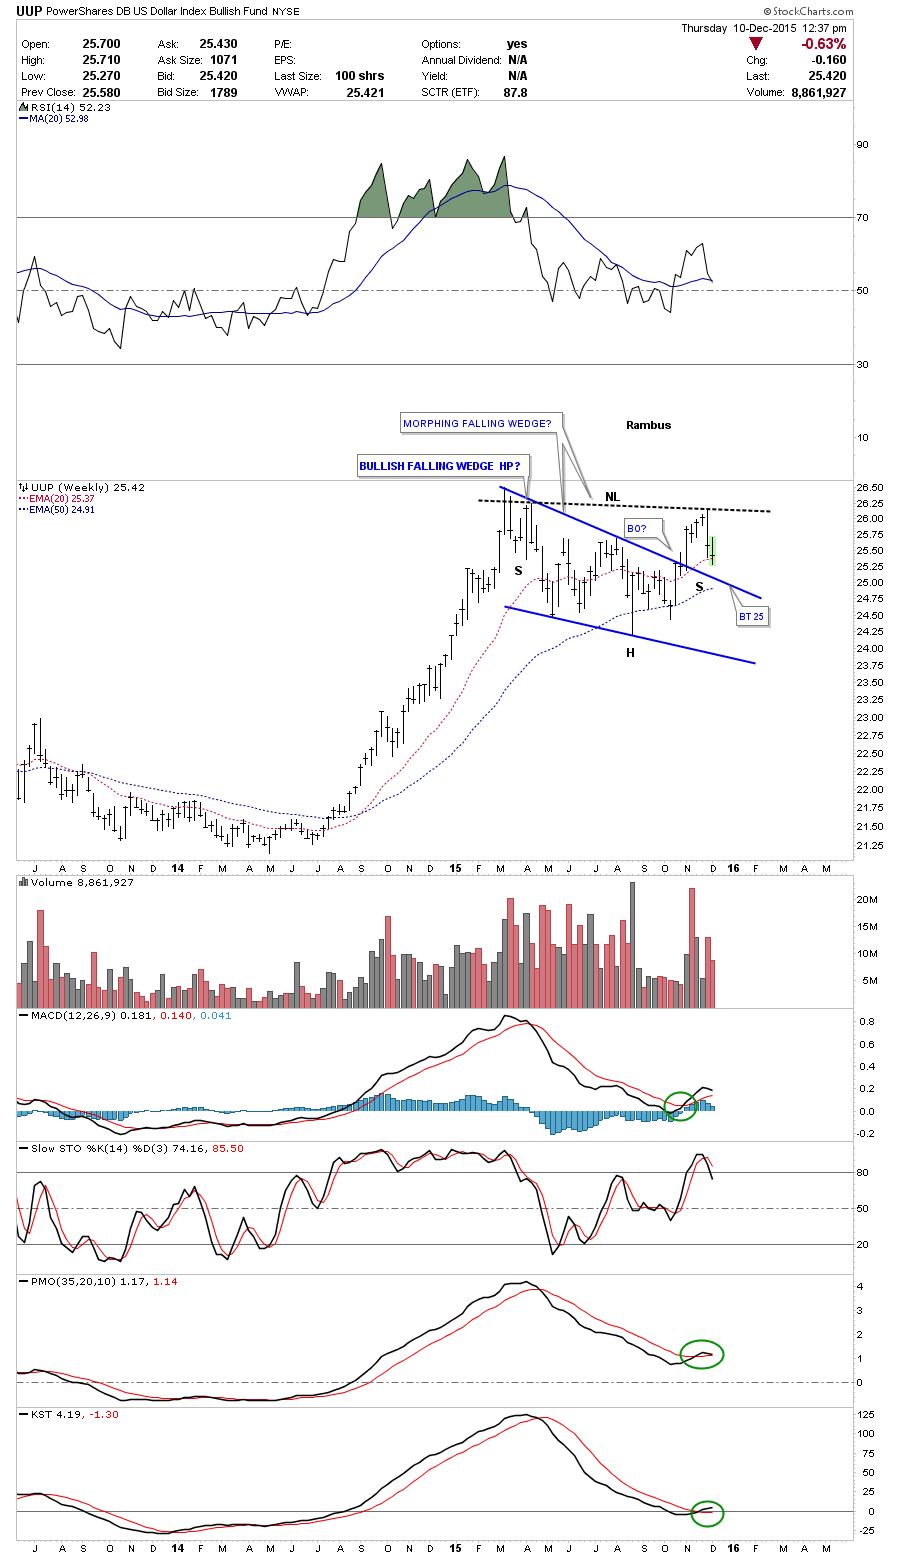
The weekly look.