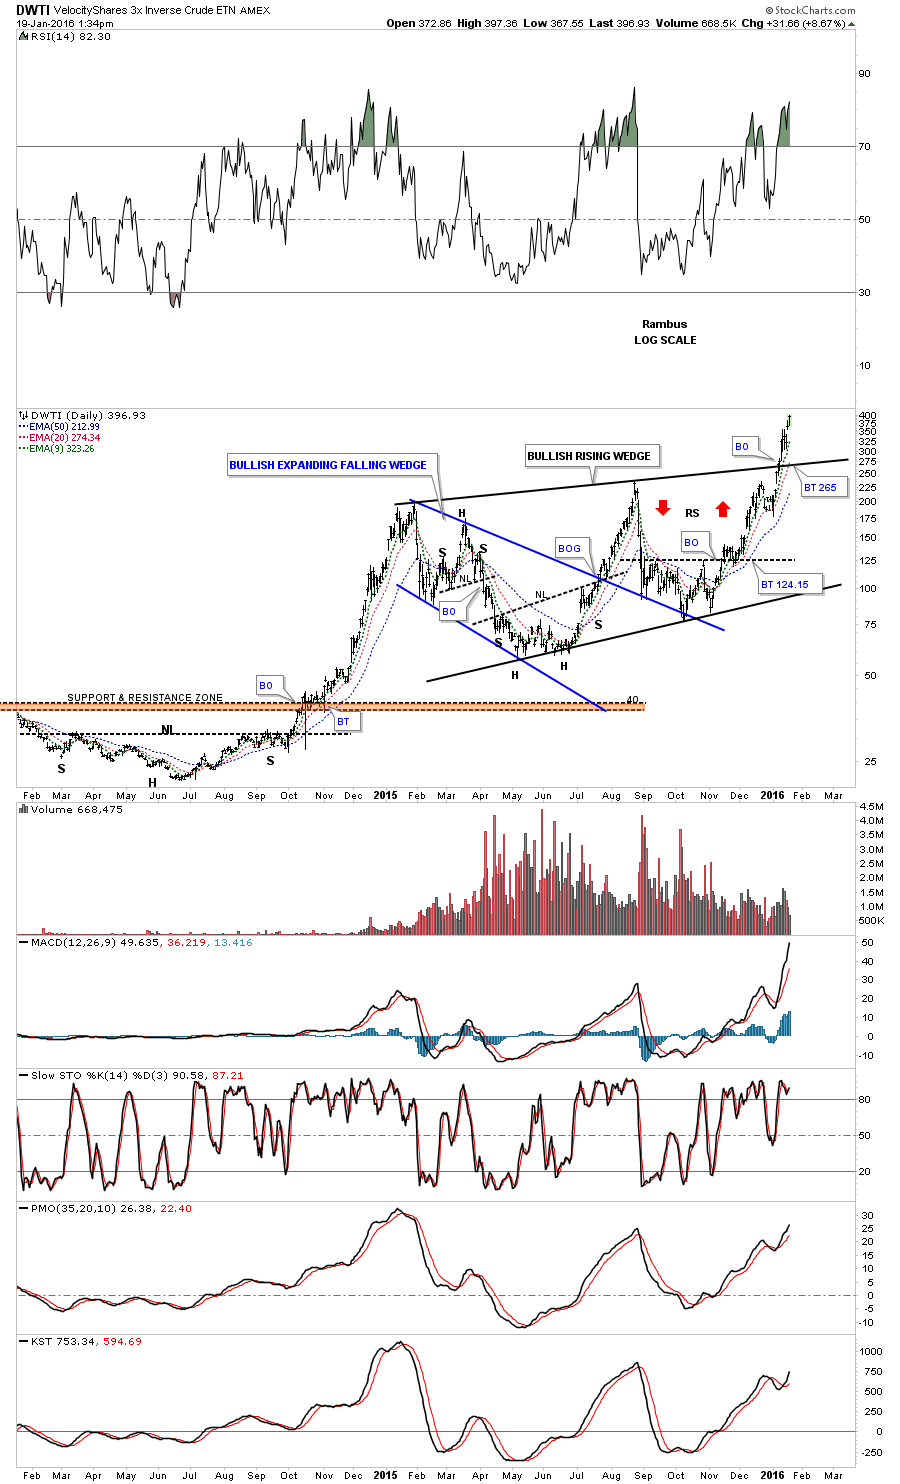
I didn’t get a chance to post this longer term daily chart for DWTI as things are moving so fast right now. This chart shows the big picture which I wasn’t able to show you on the 2 hour chart just a few minutes ago.
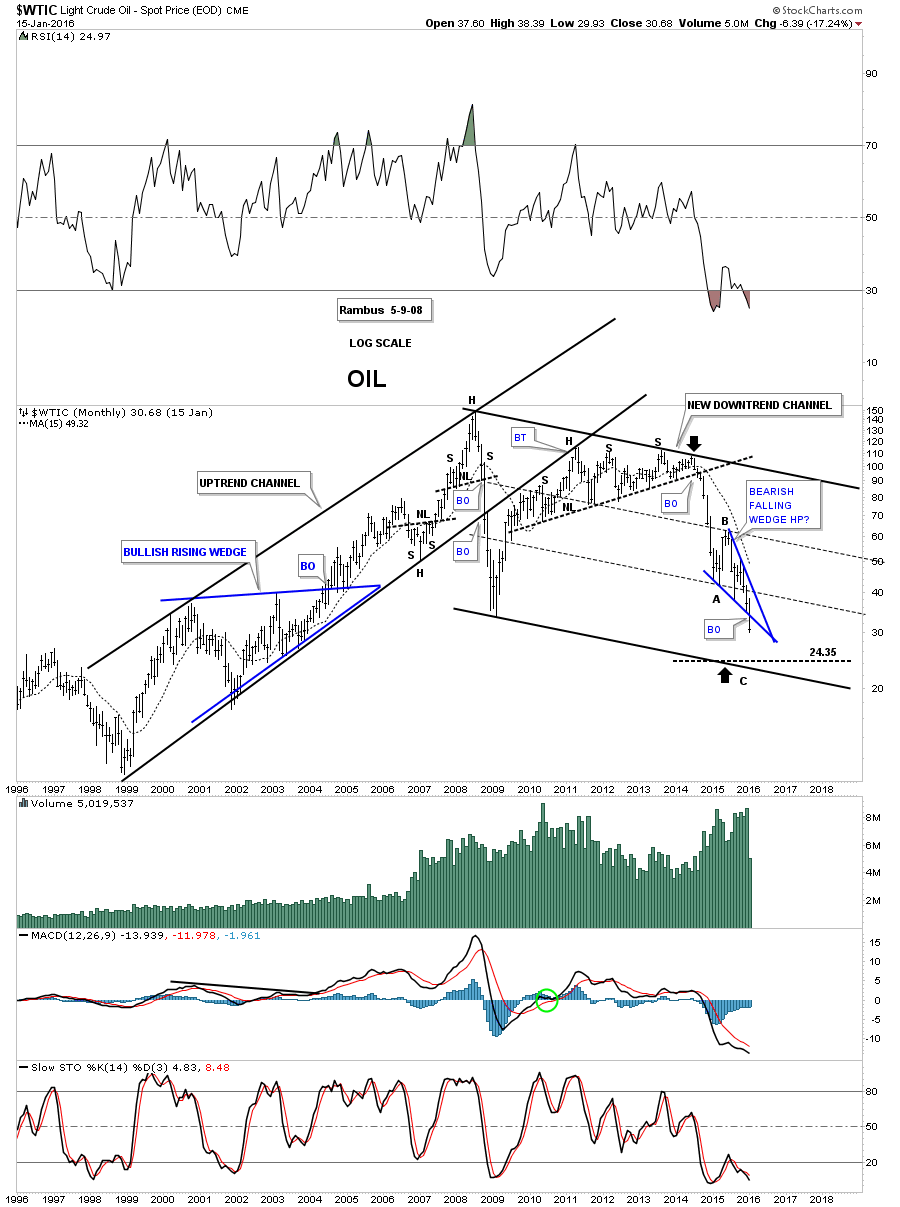
Below is a long term monthly chart for $WTIC which shows the blue bearish falling wedge as a possible part of an A B C decline, black arrows. This would be a more conservative price objective.
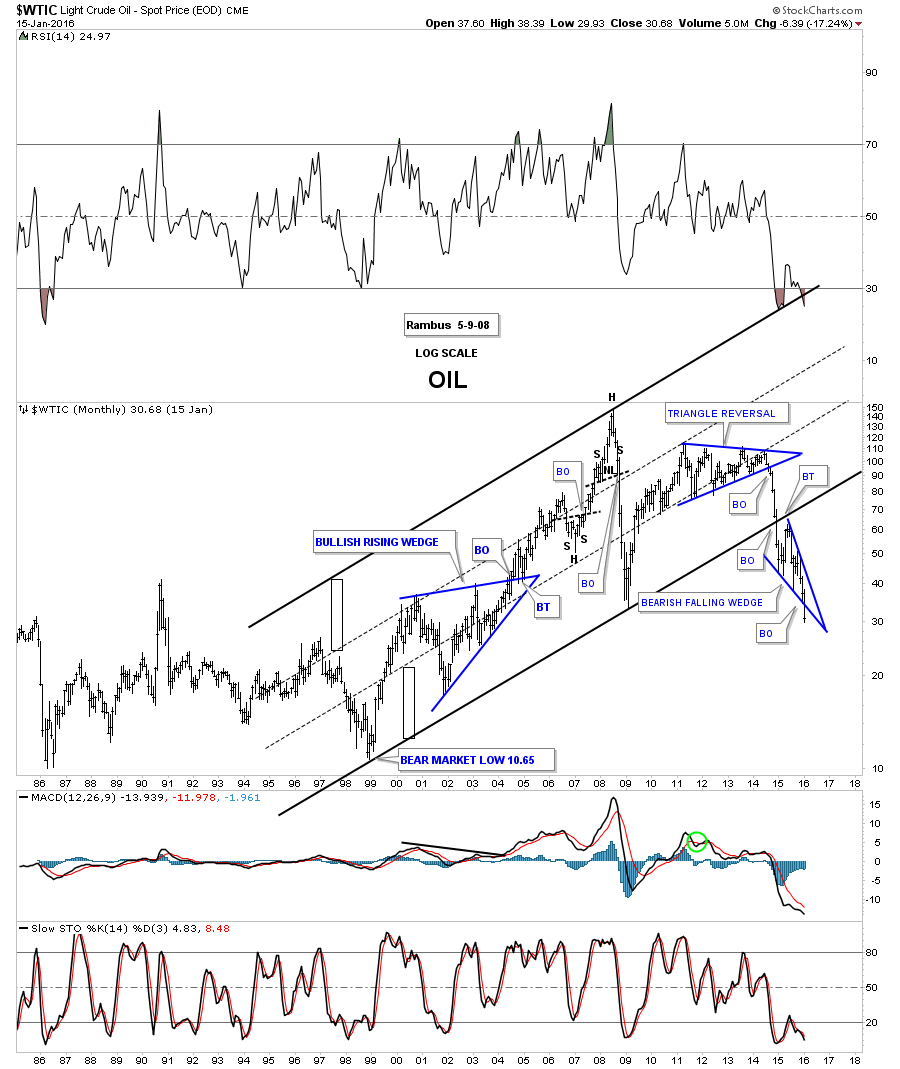
Below is a 30 year look at oil which shows how the bearish falling wedge fits into the very big picture. As you can see the price action is hitting new multi year lows now. Also notice how the blue falling wedge has formed just below the bottom rail of the major uptrend channel which is usually a bearish setup.
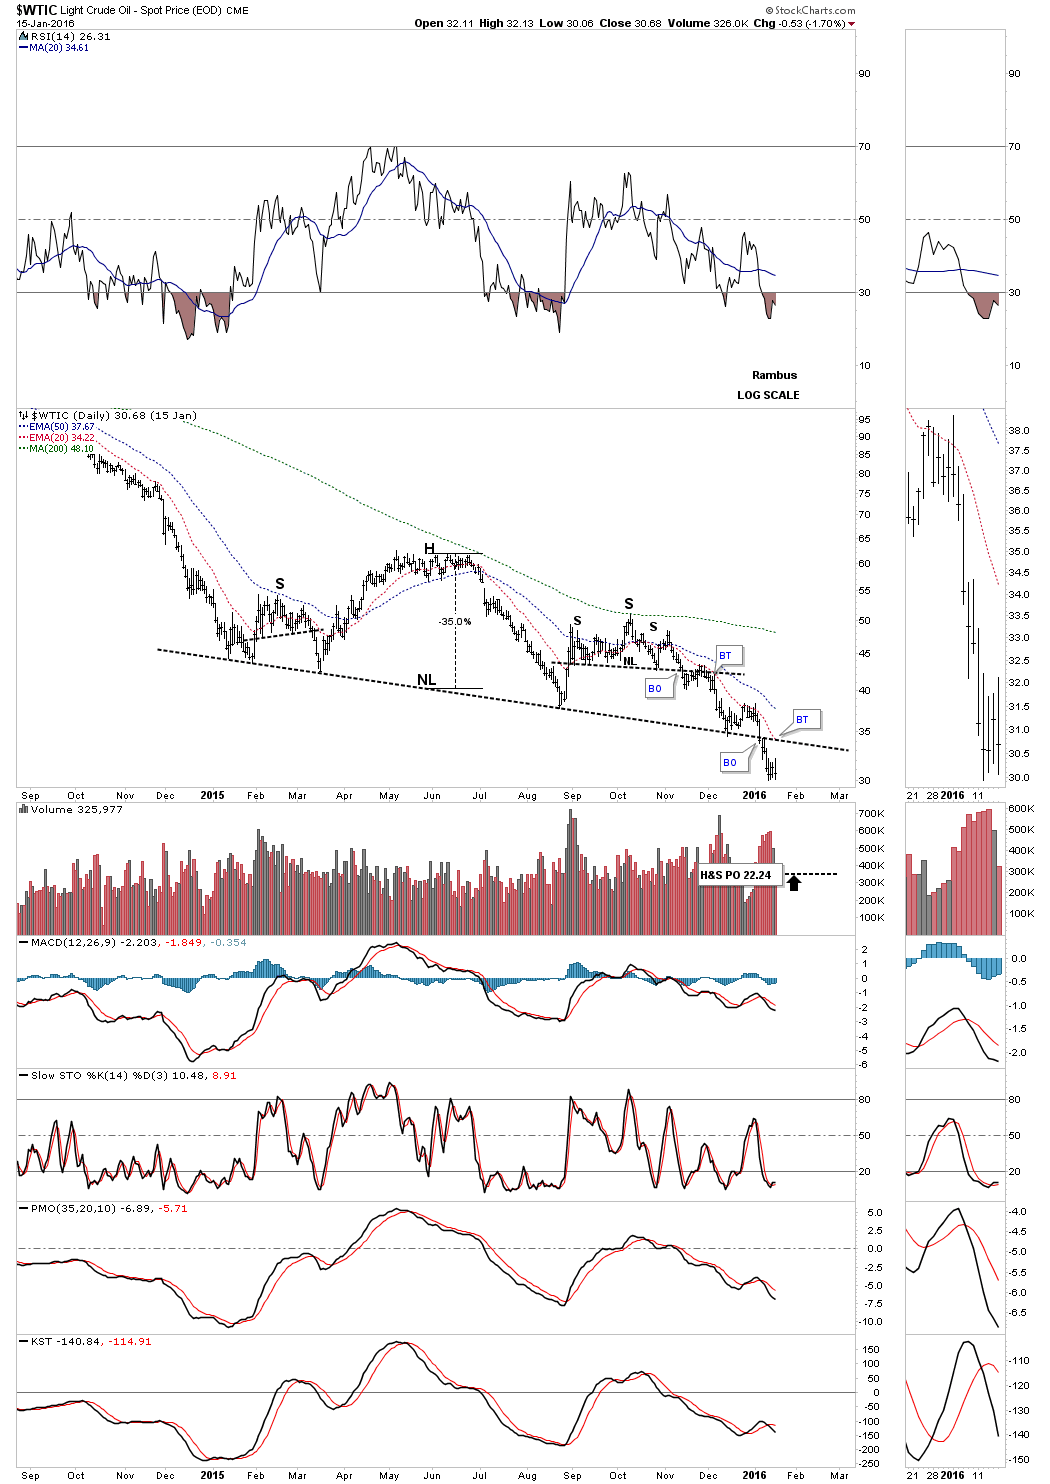
Below is a log scale chart for $WTIC which shows the H&S consolidation pattern has a price objective down to the 22.24 area.
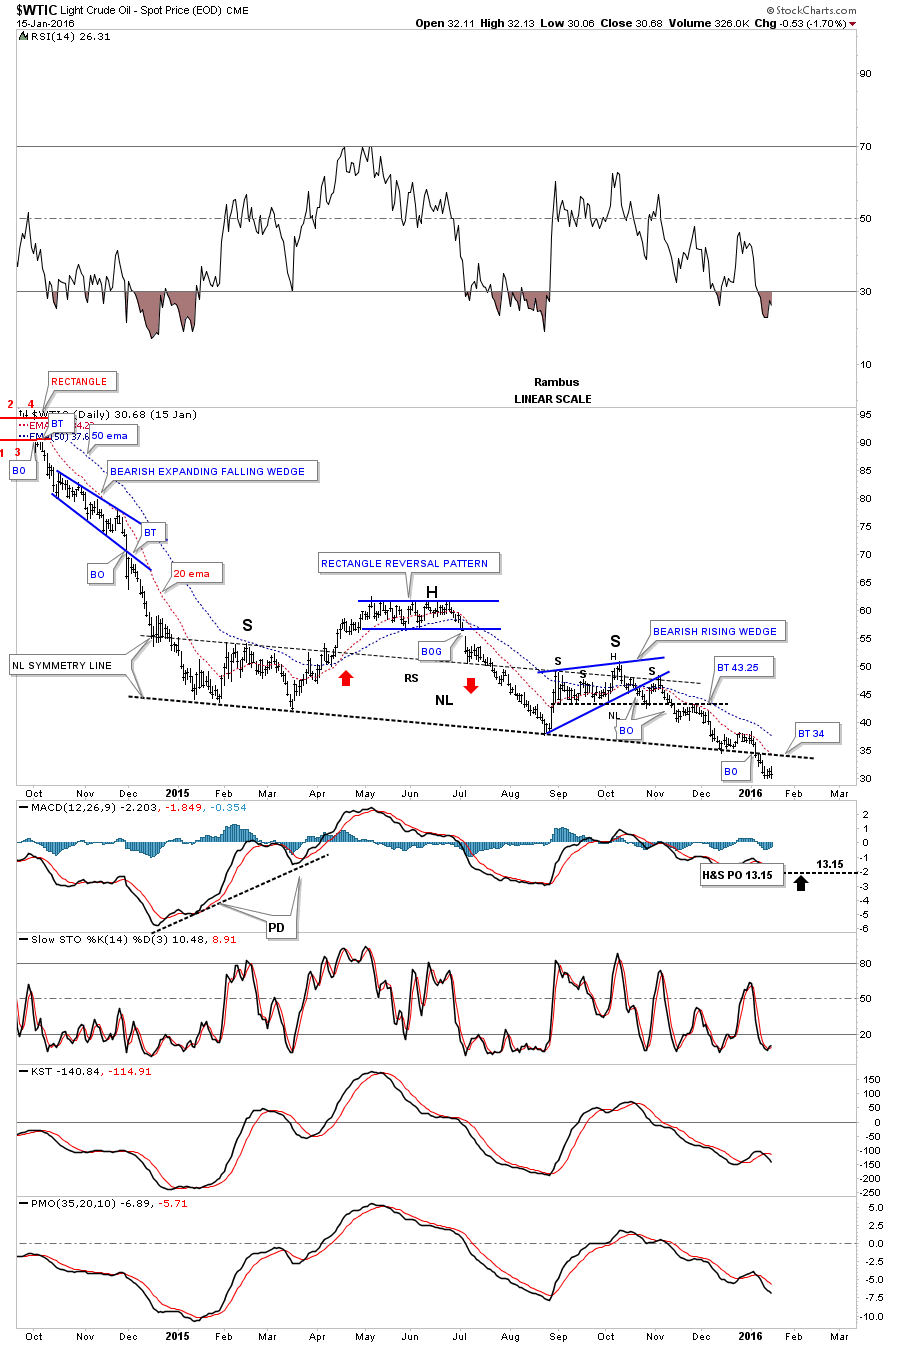
Below is a linear scale chart for oil’s H&S consolidation pattern which has a price objective down to the 13.15 area. It seems impossible but we’ll just have to keep following the price action for more clues.
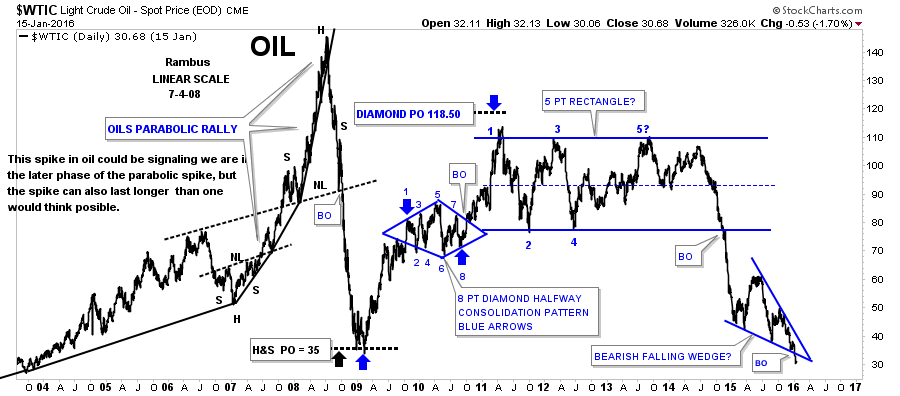
Below is a 10 year chart which shows the parabolic rise and the parabolic decline. I used the linear scale chart to measure the H&S top which gave me a price objective down to 35 which at the time seemed impossible whereas the log scale measurement was higher.