This weekend I’m going to try and put together a comprehensive report on how all the different pieces of the puzzle are fitting together right now in regards to the stock markets, precious metals complex, currencies and the commodities. There is a big picture look that I hope I can show you so you will know where I’m coming from and why I’ve taken the trades I have. All these different markets are connected in a certain way that hopefully I’ll be able to show you using charts. It will be a long report which I will post in two parts, over the weekend. Either I have the big picture right or I’ll be totally wrong in my perceptions of what the different markets are doing right now. You should have a clear understanding of the big picture after this weekend.
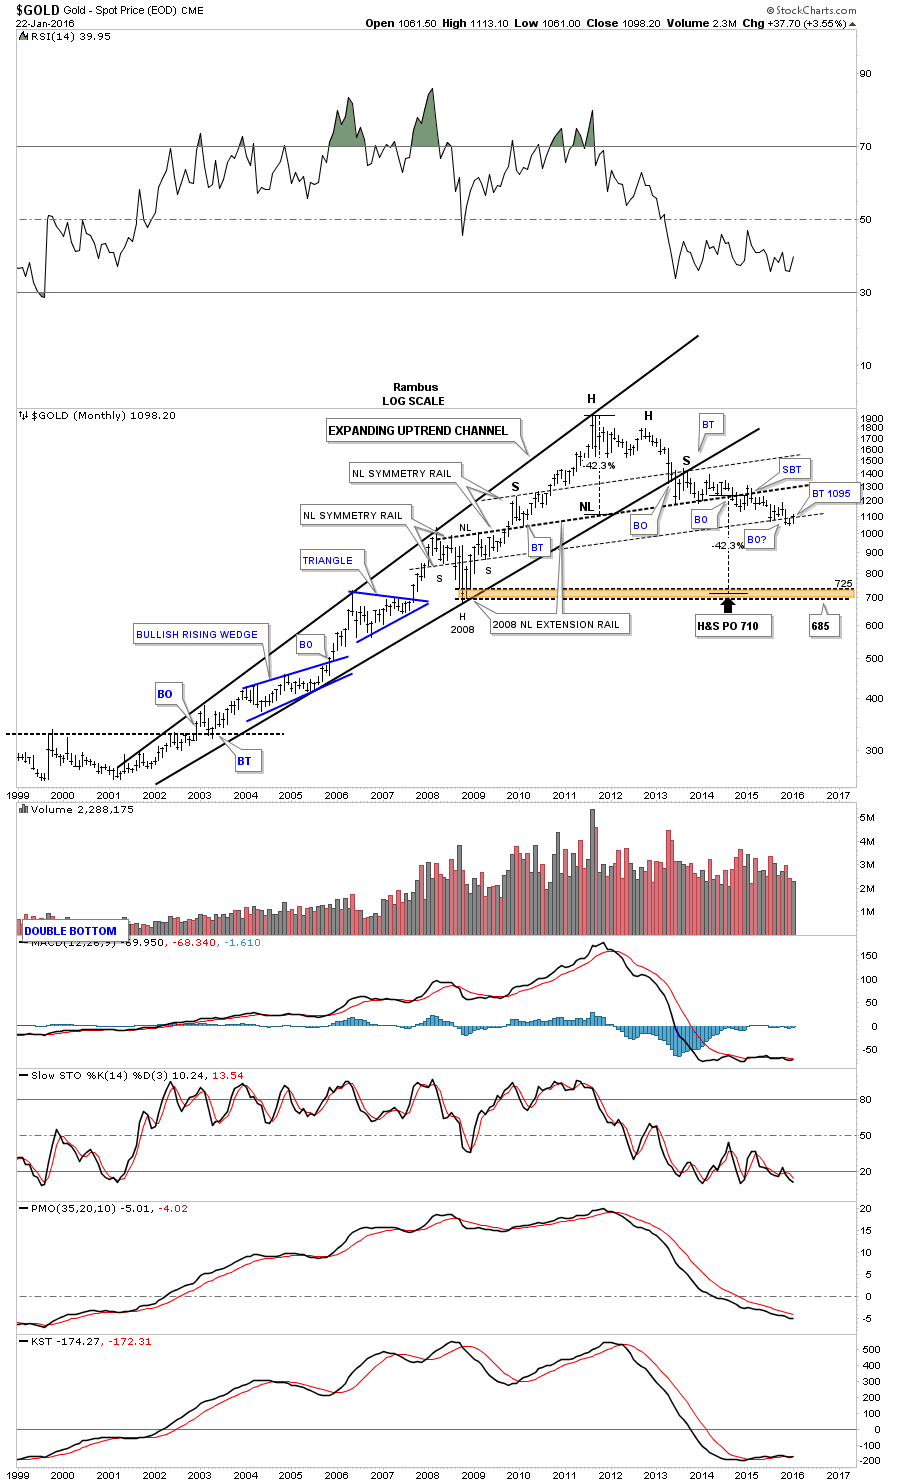
I’ve been working on a lot of charts over the last several days to get ready for the Weekend Report and I still have more to build so there will be just one chart tonight, the long term monthly chart for gold. I first built this chart back in 2013 after gold broke below the bottom rail of its bull market uptrend channel, the expanding rising wedge. You can see where gold broke below the bottom rail of its expanding rising wedge and backtested that important trendline from below which created the right shoulder of that massive H&S top.
Long term members may remember when I extended the neckline from the 2008 H&S consolidation pattern all the way across the chart which came right in line with the initial break of the bottom rail of the bearish expanding rising wedge. It’s called the 2008 neckline extension rail with the heavy NL on it. That heavy neckline held support for close to 15 months before the price action finally broke below it signalling the big H&S top was breaking out. You can see there was a strong backtest to the underside of the heavy neckline but it held resistance. From that strong backtest high gold spent the next year declining down to the lowest neckline symmetry line which is taken from the bottom of the left and right shoulder of the 2008 H&S consolidation pattern.
Gold finally broke below the lowest neckline symmetry rail in November of last year, third bar from the right. So far gold has been backtesting the neckline symmetry rail for this month of January. There is still one more week left to trade this month so it’ll be interesting to see if the neckline symmetry rail holds resistance. If the current backtest holds resistance and gold begins to break below last months low then it should start heading for the massive H&S price objective down to the 685 to 725 area as shown by the brown shaded support and resistance zone.
Ever since I put that heavy neckline extension rail on this chart there hasn’t been one time when I thought the bear market was over. Just the opposite as you can see by the series of lower lows and lower highs all the way down from the bull market top in 2011. Just think for a moment about how hard its been for us shorting this bear market vs all the gold investors who have bought each bottom thinking the bear market was over and each time gold went lower. The bottom line is that it looks like 2016 is going to be a very interesting year. Have a great weekend and all the best…Rambus
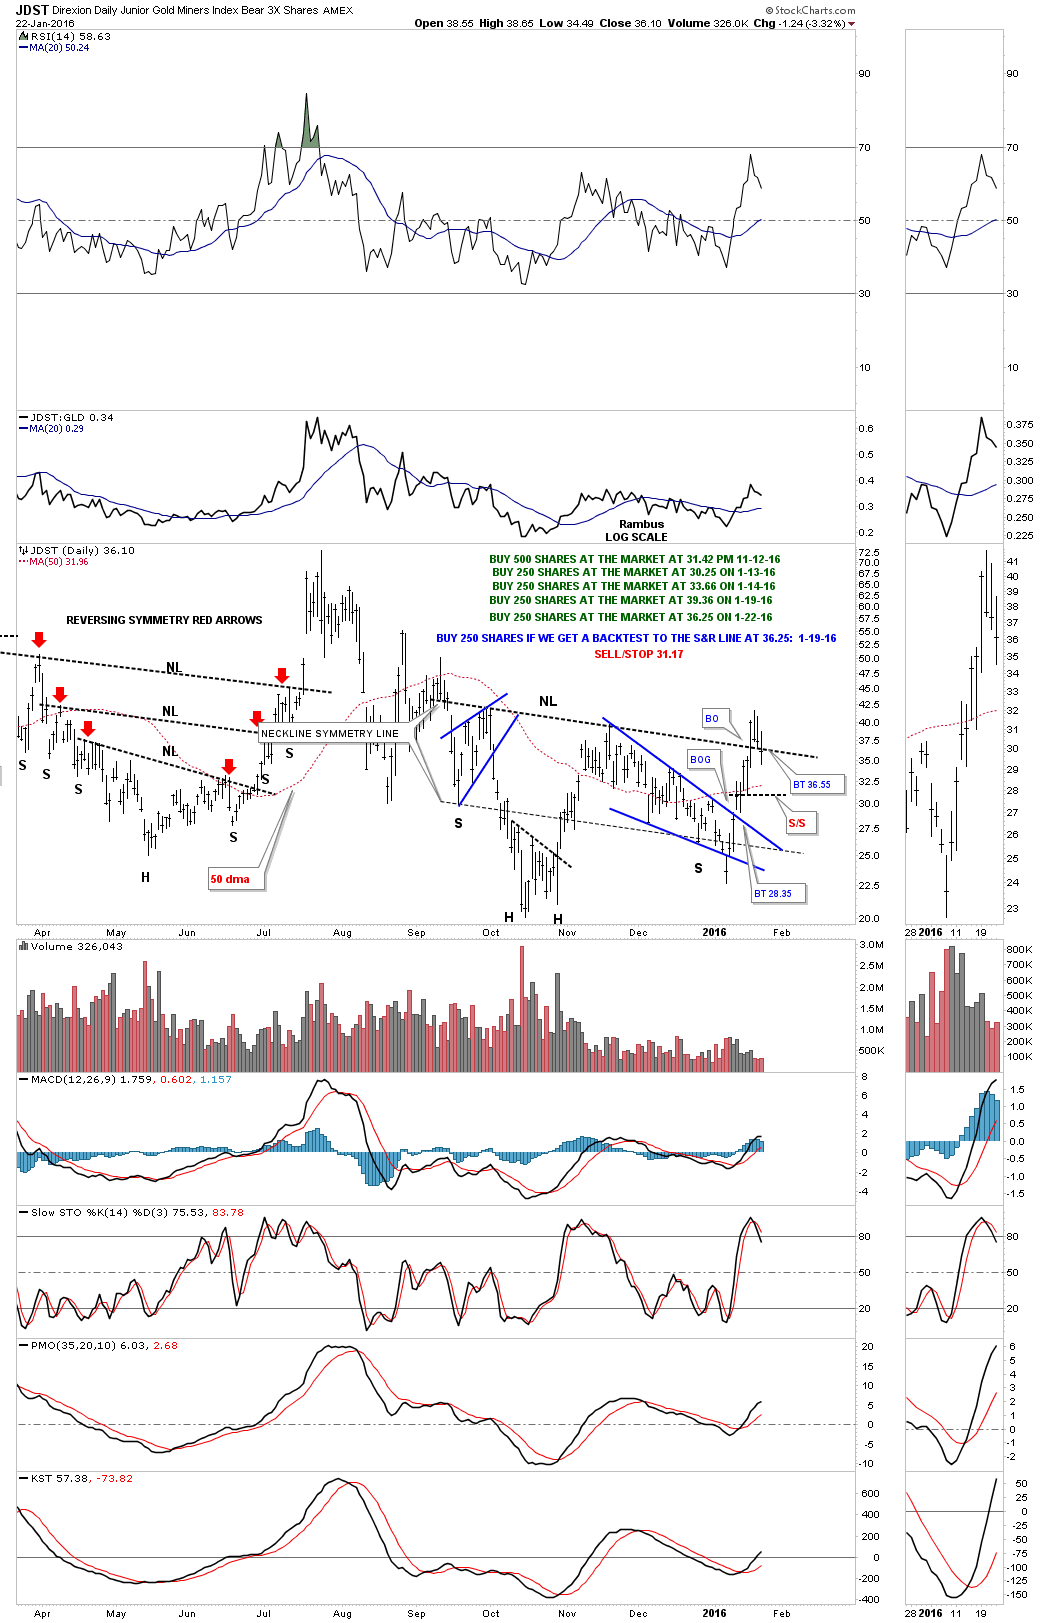
PS: My buy point was hit today on JDST when it backtested the S&R line at 36.25 where I bought another small position of 250 shares. As you can see this is a critical backtest taking place right now.